トリプルSuperTrendとStoch RSI戦略

概要
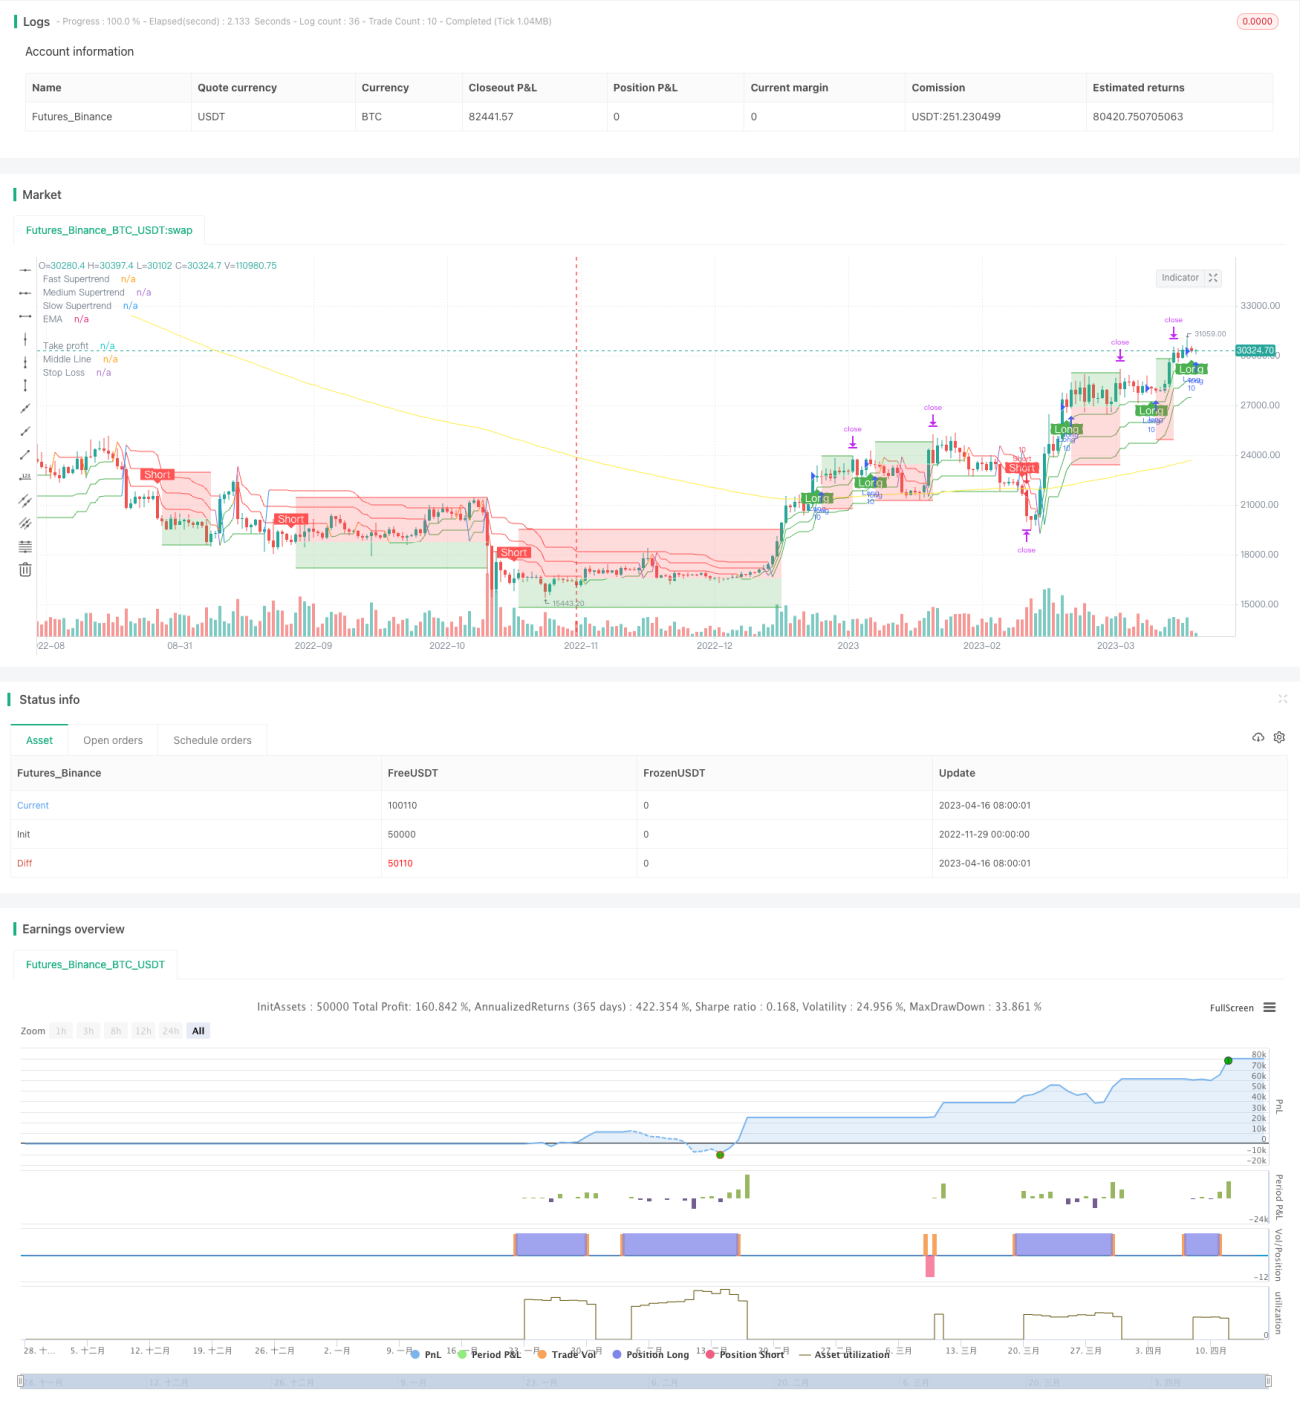
トリプルスーパートレンドとストキャスティクスRSI戦略は、複数の時間枠を組み合わせたトレンドフォローと買われすぎ・売られすぎ指標を用いた定量取引戦略です。この戦略は、パラメータ設定の異なる3つのスーパートレンド指標を用いて市場トレンドを判断し、さらにストキャスティクスRSI指標の買われすぎ・売られすぎシグナルと組み合わせて取引シグナルを生成します。具体的には、2つのより速いスーパートレンド指標が同時に買い/売りシグナルを発し、かつストキャスティクスRSI指標がそのシグナルを確認した場合に、対応するロング/ショートのポジションを取ります。
戦略の原理
トリプルスーパートレンドとストキャスティクスRSI戦略の中核ロジックは、パラメータの異なるスーパートレンド指標とストキャスティクスRSI指標を組み合わせて取引シグナルをフィルタリングし、シグナルの質を高め、誤シグナル率を低減することにあります。
まず、この戦略ではパラメータの異なる3組のスーパートレンド指標を使用して市場の主要トレンドを判断します。これらの3組のスーパートレンド指標はパラメータ設定が異なり、時間枠は速いものから遅いものまであり、異なるレベルのトレンド変化を捉えます。最も速いスーパートレンドと2番目に速いスーパートレンドが同時に買い/売りシグナルを発した場合、そのシグナルには一定の信頼性があると初期判断します。
次に、戦略はストキャスティクスRSI指標を導入して、そのシグナルが過度に買われすぎまたは売られすぎでないかを判断します。ストキャスティクスRSI指標は、RSIとストキャスティクスの利点を組み合わせたもので、市場が買われすぎまたは売られすぎの状態にあるかどうかを効果的に判断できます。最も速いスーパートレンドと2番目に速いスーパートレンドのシグナルがストキャスティクスRSI指標のシグナルと一致した場合、最終的な買い/売りシグナルを発します。
複数の指標と複数の時間枠を組み合わせることで、トリプルスーパートレンドとストキャスティクスRSI戦略は市場ノイズを効果的にフィルタリングし、シグナルの信頼性を高め、誤取引の発生を低減します。
戦略の利点
トリプルスーパートレンドとストキャスティクスRSI戦略の最大の利点は、複数の指標と複数の時間枠を効果的に組み合わせていることであり、これにより以下のメリットが得られます。
-
誤った取引シグナルの低減。トリプルスーパートレンド指標とストキャスティクスRSI指標の組み合わせにより、単一指標に存在するノイズシグナルや誤シグナルを大幅に削減できます。
-
利益シグナル比率の向上。シグナル頻度は低下しますが、利益シグナルの割合が顕著に向上します。
-
トレンド相場に適している。複数時間枠でのフィルタリングは中長期的なトレンドの捕捉に有利であり、トレンドが明確な市場環境に適しています。
-
パラメータ最適化により容易に効果を向上できる。3つの指標により、パラメータ最適化の可能性の幅が広がります。
-
個人のスタイルに合わせてパラメータを調整可能。パラメータを自由に調整することで、自分の取引スタイルに合わせることができます。
戦略のリスク
トリプルスーパートレンドとストキャスティクスRSI戦略には以下のような一定のリスクも存在します。
-
シグナル頻度の低下。多重フィルタリング機構により、取引頻度が明らかに低下します。
-
一部のシグナルを見逃しやすい。戦略の保守性により、潜在的なチャンスの一部を見逃す可能性があります。
-
指標が増えることでパラメータ依存性が高まる。指標とパラメータが増えるほど、戦略の最適化難易度も高まります。
-
フォロー能力に限界がある。複数時間枠の組み合わせにより、トレンドに追従する柔軟性が制限されます。
上記リスクに対しては、指標パラメータの調整や、より多くの補助判断指標の導入などによる最適化を行い、リスクを管理しつつ、より高い利益の質を得ることが可能です。
戦略の最適化方向性
トリプルスーパートレンドとストキャスティクスRSI戦略にはさらなる最適化の余地があり、主に以下の点から取り組むことができます。
-
指標パラメータの組み合わせを調整し、最適なパラメータマッチングを見つける。より多くの指標パラメータセットをテストし、最適パラメータを探索できます。
-
ストップロス・テイクプロフィット戦略を追加し、1回の取引リスクを管理する。これにより戦略の安定性が大幅に向上します。
-
より多くの判断指標を導入してシグナルを検証する。例えば出来高指標などを導入し、多角的な判断を行います。
-
適応機能の追加。戦略が自動的にパラメータを最適化・調整し、市場の変化に対応できるようにします。
-
機械学習アルゴリズムを組み合わせて予測を行う。AIアルゴリズムを利用して指標シグナルの正確性を予測します。
継続的な最適化により、トリプルスーパートレンドとストキャスティクスRSI戦略は安定かつ効率的な定量取引戦略へと成長し、魅力的なアルファをもたらす可能性があります。
まとめ
トリプルスーパートレンドとストキャスティクスRSI戦略は、複数時間枠分析と買われすぎ・売られすぎ判断をうまく組み合わせ、独自のトレンドフォロー型取引戦略を形成しています。トレンドフォローと指標フィルタリングの両方の利点を併せ持ち、ノイズシグナルを低減しつつ利益シグナルの割合を向上させます。リスクや最適化の余地は依然として存在しますが、パラメータ調整や戦略最適化により、その収益力と安定性はさらに向上させることが可能です。総じて、トリプルスーパートレンドとストキャスティクスRSI戦略は、定量取引の実践において質の高い戦略選択肢を提供します。
- 1