
この戦略はブリン帯指数に基づいており,移動平均とATR技術指数と組み合わせて,短周期のブレイクシステムを実現する.戦略はブリン帯通路内の価格の相対位置のパーセントを計算して,価格の超買超売り状況を判断し,新しい高低点ブレイクと組み合わせて取引信号を生成する.
この戦略はブリン帯通路を用いて市場の波動率を判断し,ブリン帯通路の幅は標準差によって決定される。価格がブリン帯から下線突破時に買点であり,価格がブリン帯から上線突破時に売点である。移動平均線はブリン帯の波動を平坦化し,偽突破を軽減する。ATR指標は,移動ストップラインと結合し,固定ストップの幅度である。新高新低判断は,年度破綻の追尾を回避する。高低判断は,大レベルの横軸整理を排除する。全体的に言えば,この戦略は,市場リズムと市場入場時の判断に多種多様な技術的分析ツールを総合的に使用する。
この戦略は,ブリン帯パーセント,移動平均,ATR指標,新高新低,年次高低などの複数の技術的ツールを総合的に使用して,短い周期で比較的厳格で高効率の突破取引戦略を構築している.その顕著な優点は,ノイズを減らすために,真のトレンド信号を認識するために,さまざまな種類のツールを利用することにある.もちろん,戦略には,特定のパラメータの設定の難しさと厳しい条件下でチャンスを逃す可能性もある.全体的には,独自の取引スタイルと突破率を持つブリン帯突破戦略であり,さらなる研究と実在データに基づく実験によって証明される価値があります.
/*backtest
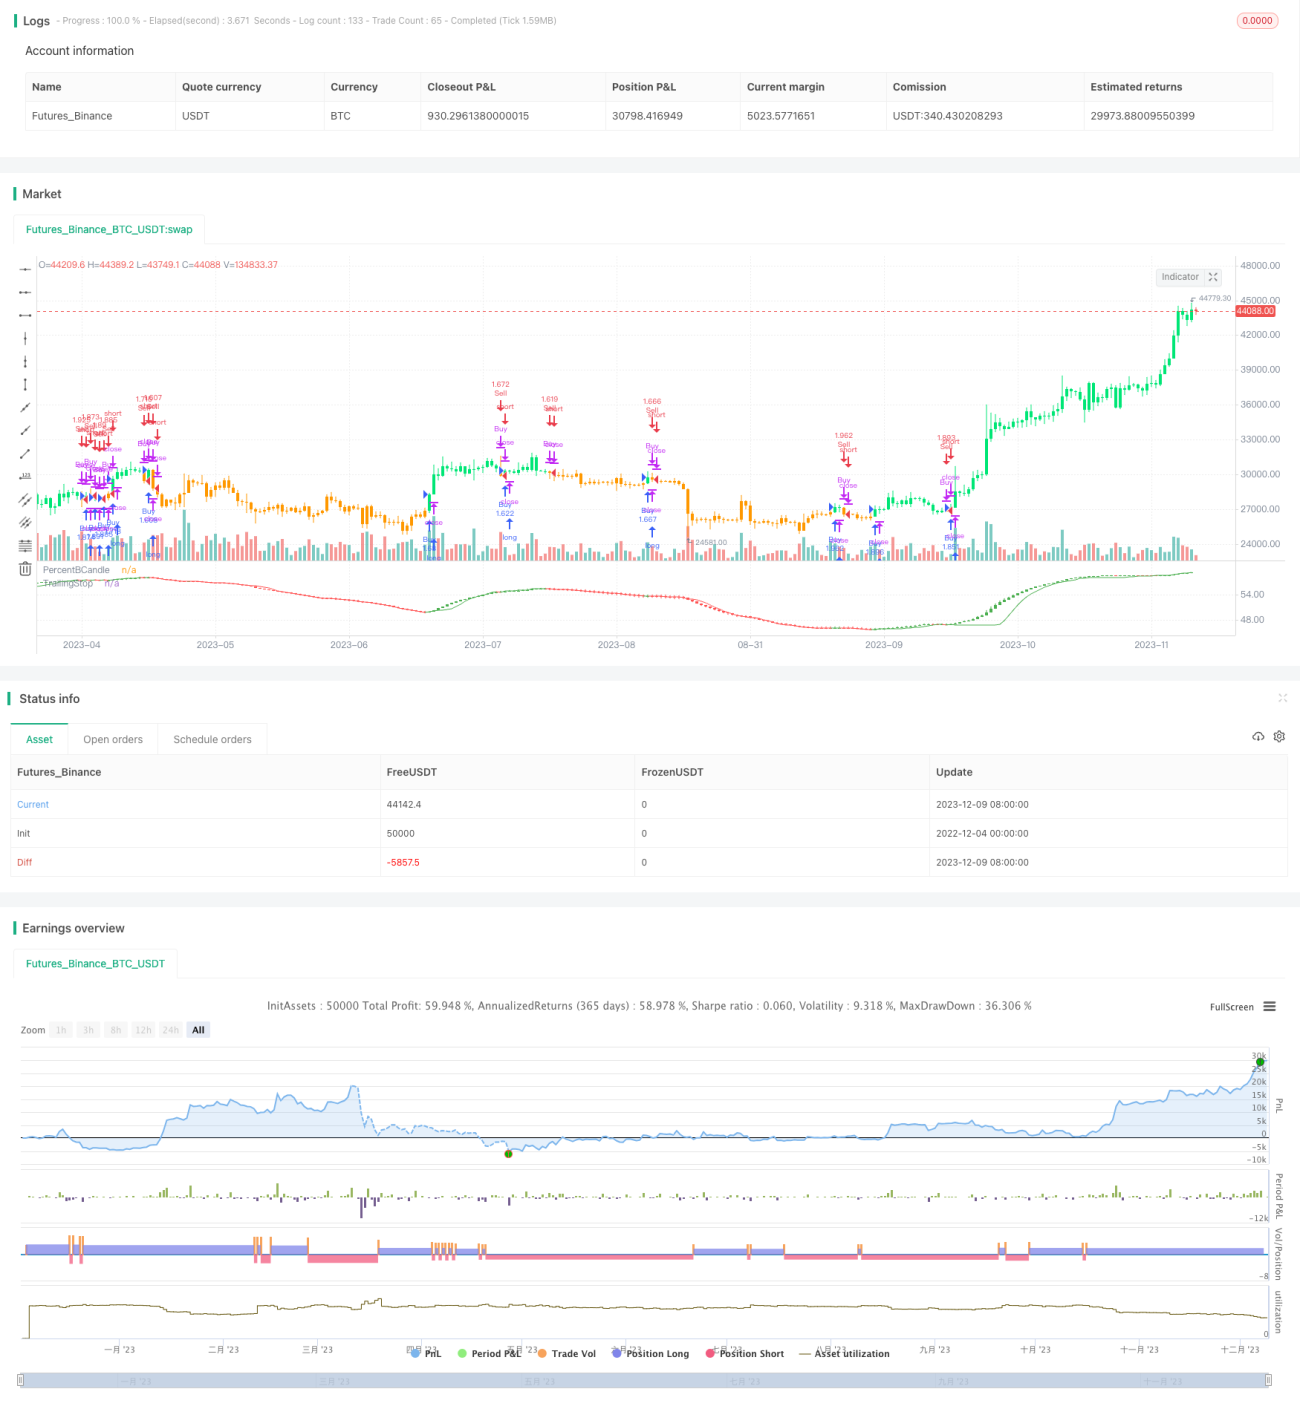
start: 2022-12-04 00:00:00
end: 2023-12-10 00:00:00
period: 1d
basePeriod: 1h
exchanges: [{"eid":"Futures_Binance","currency":"BTC_USDT"}]
*/
// This source code is subject to the terms of the Mozilla Public License 2.0 at https://mozilla.org/MPL/2.0/
// © HeWhoMustNotBeNamed
//@version=4
strategy("Bollinger %B Candles Strategy", overlay=false, initial_capital = 1000, default_qty_type = strategy.percent_of_equity, default_qty_value = 100, commission_type = strategy.commission.percent, pyramiding = 1, commission_value = 0.01, calc_on_order_fills = true)
BBLength = input(100, minval=1, step=1)
StdDev = 10
useMovingAverage = input(true)
MAType = input(title="Moving Average Type", defval="rma", options=["ema", "sma", "hma", "rma", "vwma", "wma"])
lookbackPeriod = input(22, minval=10, step=10)
colorByPreviousClose = input(true)
AtrMAType = input(title="Moving Average Type", defval="hma", options=["ema", "sma", "hma", "rma", "vwma", "wma"])
AtrLength = input(10)
AtrMult = input(4)
wicks = input(false)
considerYearlyHighLow = input(false)
considerNewLongTermHighLows = input(false)
shortHighLowPeriod = 100
longHighLowPeriod = 200
tradeDirection = input(title="Trade Direction", defval=strategy.direction.all, options=[strategy.direction.all, strategy.direction.long, strategy.direction.short])
backtestYears = input(10, minval=1, step=1)
//////////////////////////////////// Calculate new high low condition //////////////////////////////////////////////////
f_calculateNewHighLows(shortHighLowPeriod, longHighLowPeriod, considerNewLongTermHighLows)=>
newHigh = highest(shortHighLowPeriod) == highest(longHighLowPeriod) or not considerNewLongTermHighLows
newLow = lowest(shortHighLowPeriod) == lowest(longHighLowPeriod) or not considerNewLongTermHighLows
[newHigh,newLow]
//////////////////////////////////// Calculate Yearly High Low //////////////////////////////////////////////////
f_getYearlyHighLowCondition(considerYearlyHighLow)=>
yhigh = security(syminfo.tickerid, '12M', high[1])
ylow = security(syminfo.tickerid, '12M', low[1])
yhighlast = yhigh[365]
ylowlast = ylow[365]
yhighllast = yhigh[2 * 365]
ylowllast = ylow[2 * 365]
yearlyTrendUp = na(yhigh)? true : na(yhighlast)? close > yhigh : na(yhighllast)? close > max(yhigh,yhighlast) : close > max(yhigh, min(yhighlast, yhighllast))
yearlyHighCondition = ( (na(yhigh) or na(yhighlast) ? true : (yhigh > yhighlast) ) and ( na(yhigh) or na(yhighllast) ? true : (yhigh > yhighllast))) or yearlyTrendUp or not considerYearlyHighLow
yearlyTrendDown = na(ylow)? true : na(ylowlast)? close < ylow : na(ylowllast)? close < min(ylow,ylowlast) : close < min(ylow, max(ylowlast, ylowllast))
yearlyLowCondition = ( (na(ylow) or na(ylowlast) ? true : (ylow < ylowlast) ) and ( na(ylow) or na(ylowllast) ? true : (ylow < ylowllast))) or yearlyTrendDown or not considerYearlyHighLow
label_x = time+(60*60*24*1000*1)
[yearlyHighCondition,yearlyLowCondition]
f_getMovingAverage(source, MAType, length)=>
ma = sma(source, length)
if(MAType == "ema")
ma := ema(source,length)
if(MAType == "hma")
ma := hma(source,length)
if(MAType == "rma")
ma := rma(source,length)
if(MAType == "vwma")
ma := vwma(source,length)
if(MAType == "wma")
ma := wma(source,length)
ma
inDateRange = true
[yearlyHighCondition,yearlyLowCondition] = f_getYearlyHighLowCondition(considerYearlyHighLow)
[newHighS,newLowS] = f_calculateNewHighLows(shortHighLowPeriod, longHighLowPeriod, considerNewLongTermHighLows)
[middleclose, upperclose, lowerclose] = bb(close, BBLength, StdDev)
[middleopen, upperopen, loweropen] = bb(open, BBLength, StdDev)
[middlehigh, upperhigh, lowerhigh] = bb(high, BBLength, StdDev)
[middlelow, upperlow, lowerlow] = bb(low, BBLength, StdDev)
percentBClose = (close - lowerclose)*100/(upperclose-lowerclose)
percentBOpen = (open - loweropen)*100/(upperopen-loweropen)
percentBHigh = (high - lowerhigh)*100/(upperhigh-lowerhigh)
percentBLow = (low - lowerlow)*100/(upperlow-lowerlow)
percentBMAClose = f_getMovingAverage(percentBClose, MAType, lookbackPeriod)
percentBMAOpen = f_getMovingAverage(percentBOpen, MAType, lookbackPeriod)
percentBMAHigh = f_getMovingAverage(percentBHigh, MAType, lookbackPeriod)
percentBMALow = f_getMovingAverage(percentBLow, MAType, lookbackPeriod)
newOpen = useMovingAverage? percentBMAOpen : percentBOpen
newClose = useMovingAverage? percentBMAClose : percentBClose
newHigh = useMovingAverage? percentBMAHigh : percentBHigh
newLow = useMovingAverage? percentBMALow : percentBLow
truerange = max(newHigh, newClose[1]) - min(newLow, newClose[1])
averagetruerange = f_getMovingAverage(truerange, AtrMAType, AtrLength)
atr = averagetruerange * AtrMult
longStop = newClose - atr
longStopPrev = nz(longStop[1], longStop)
longStop := (wicks ? newLow[1] : newClose[1]) > longStopPrev ? max(longStop, longStopPrev) : longStop
shortStop = newClose + atr
shortStopPrev = nz(shortStop[1], shortStop)
shortStop := (wicks ? newHigh[1] : newClose[1]) < shortStopPrev ? min(shortStop, shortStopPrev) : shortStop
dir = 1
dir := nz(dir[1], dir)
dir := dir == -1 and (wicks ? newHigh : newClose) > shortStopPrev ? 1 : dir == 1 and (wicks ? newLow : newClose) < longStopPrev ? -1 : dir
trailingStop = dir == 1? longStop : shortStop
candleColor = colorByPreviousClose ?
(newClose[1] < newClose ? color.green : newClose[1] > newClose ? color.red : color.silver) :
(newOpen < newClose ? color.green : newOpen > newClose ? color.red : color.silver)
plotcandle(newOpen, newHigh, newLow, newClose, title='PercentBCandle', color = candleColor, wickcolor=candleColor)
plot(trailingStop, title="TrailingStop", style=plot.style_linebr, linewidth=1, color= dir == 1 ? color.green : color.red)
buyCondition = dir==1 and yearlyHighCondition and newHighS
exitBuyCondition = dir == -1
sellCondition = dir == -1 and yearlyLowCondition and newLowS
exitSellCondition = dir == 1
strategy.risk.allow_entry_in(tradeDirection)
barcolor(buyCondition? color.lime : sellCondition ? color.orange : color.silver)
strategy.entry("Buy", strategy.long, when=buyCondition and inDateRange, oca_name="oca_buy")
strategy.close("Buy", when=exitBuyCondition)
strategy.entry("Sell", strategy.short, when=sellCondition and inDateRange, oca_name="oca_sell")
strategy.close("Sell", when=exitSellCondition)