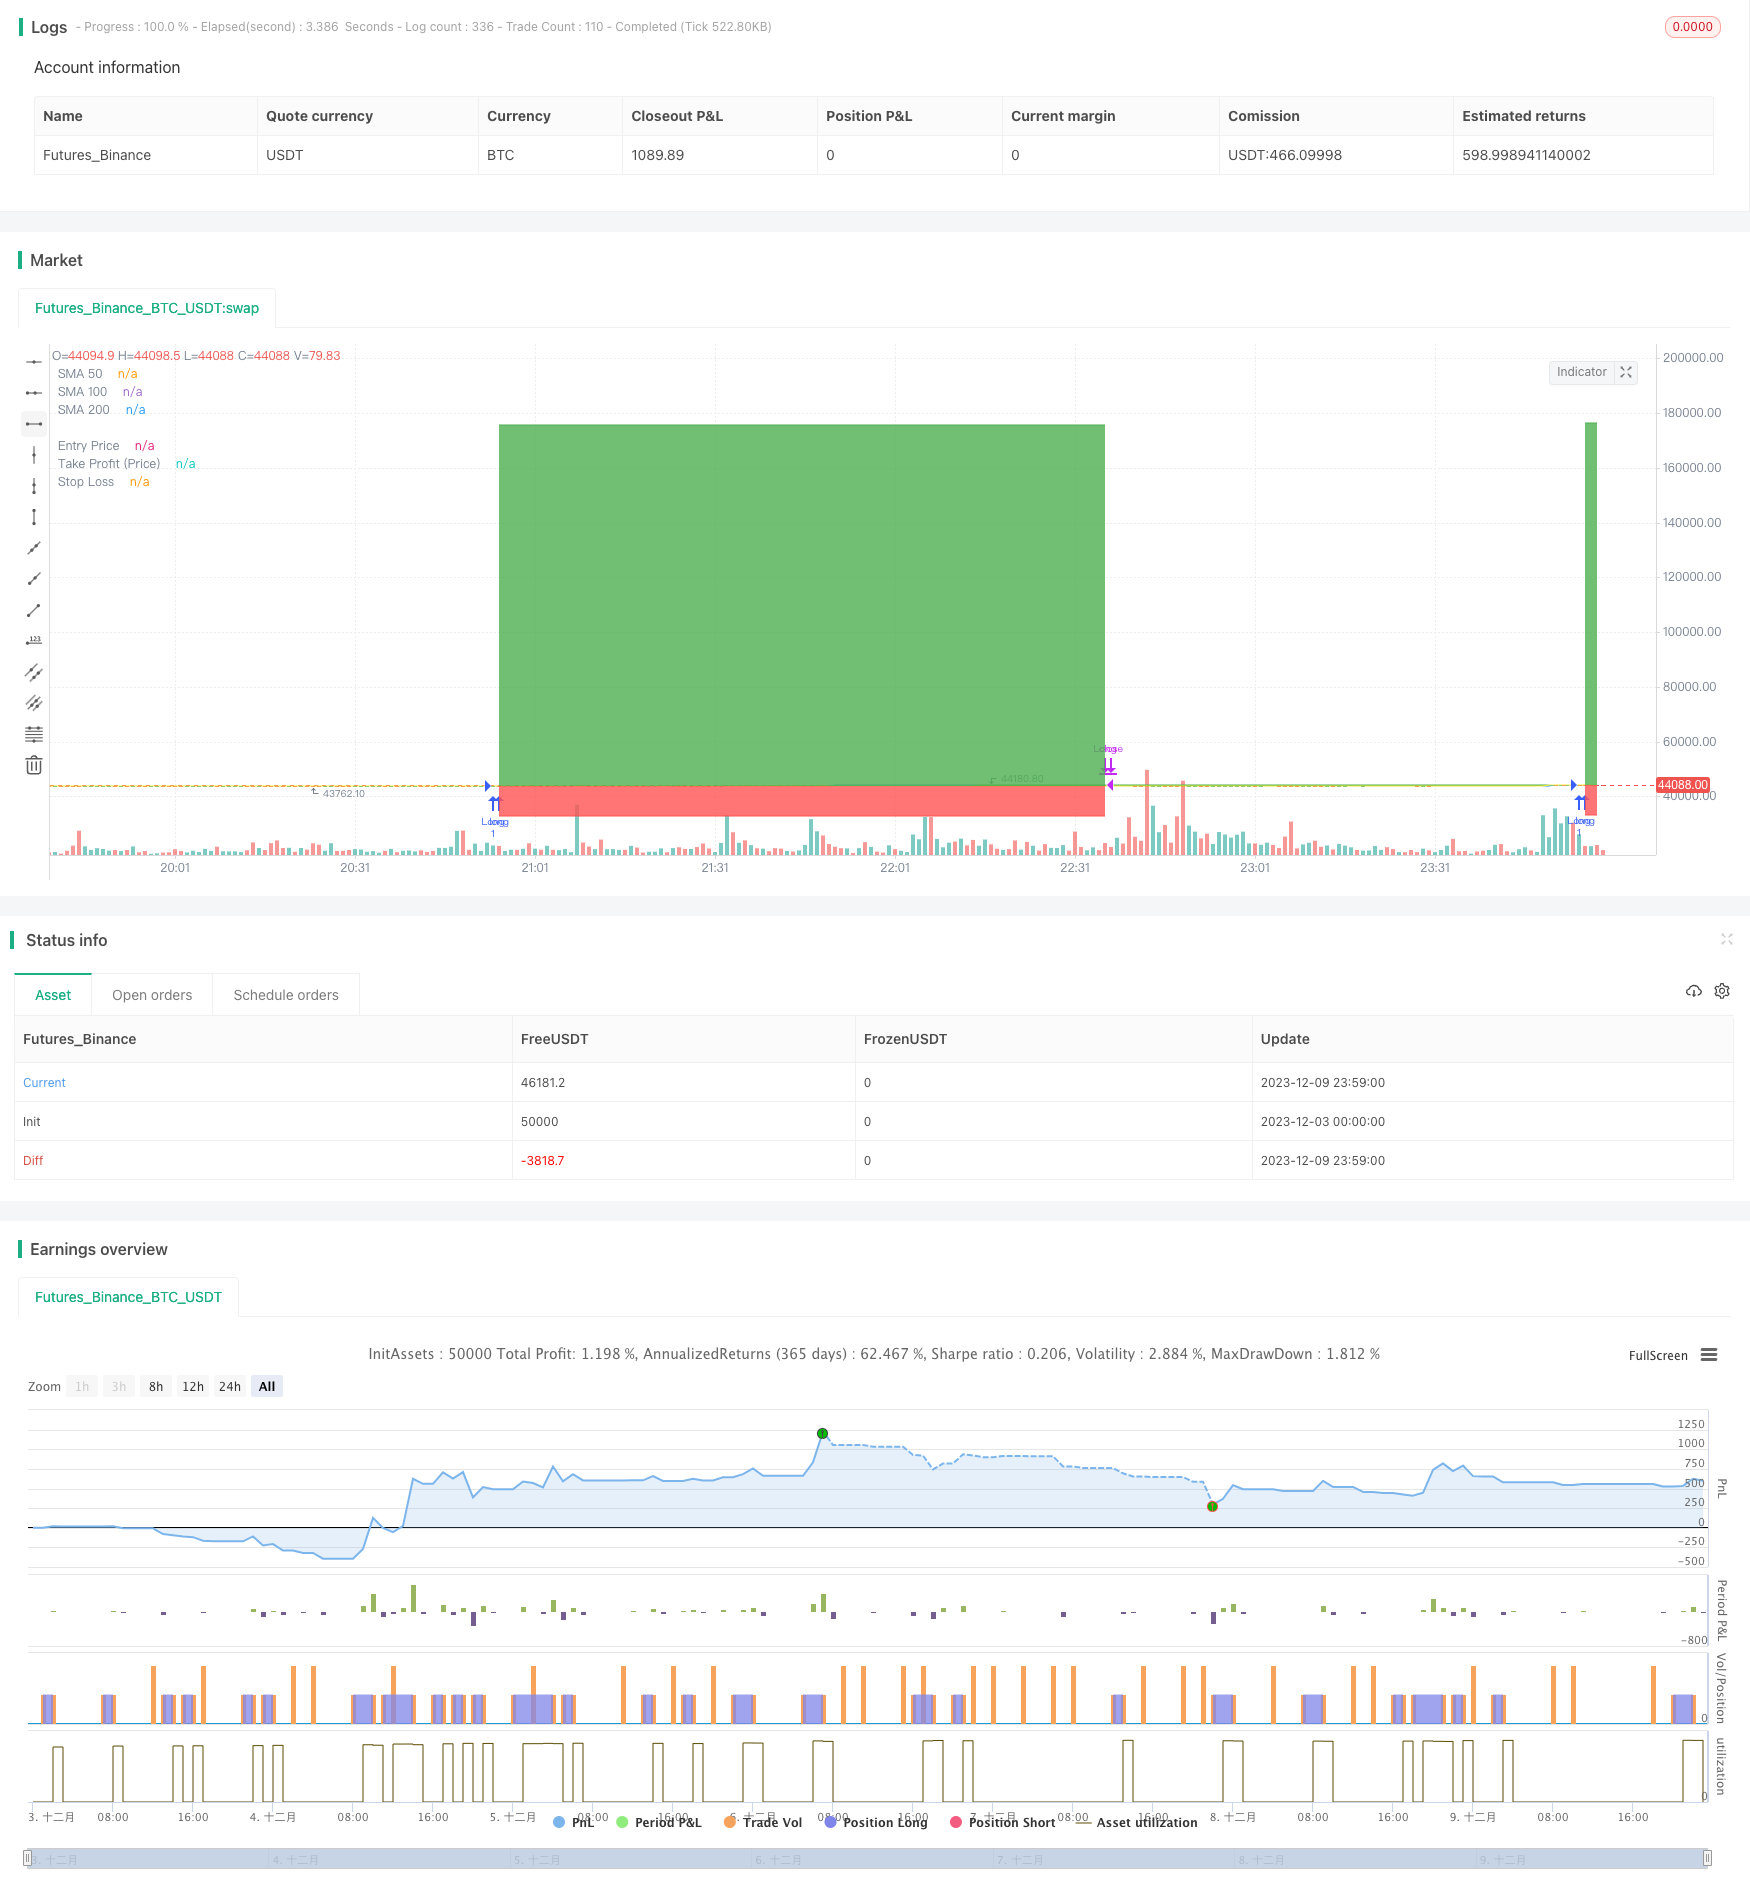
クラシックゴールデンクロス移動平均取引戦略

概要
ゴールデン・クロス・ムービング・アベレッジ・トレーディング・ストラテジー (Golden Cross Moving Average Trading Strategy) は,比較的に古典的な量的なトレーディング・ストラテジーである.このストラテジーでは,異なる周期の移動平均を適用して,市場の傾向を判断し,空白を多めに行う.短期移動平均の上部により長い周期の移動平均を穿越すると,購入信号とみなされ,短期移動平均の下部に長期移動平均を穿越すると,売却信号とみなされる.
戦略原則
この戦略は,50日線,100日線,200日線の3つの異なる周期のSMAに基づいています.具体的取引論理は以下のとおりです.
入場シグナル:50日移動平均で100日移動平均を着るとき,多入場する.
出発信号:50日移動平均線を下に100日移動平均線を突破したとき,平仓出場;または,閉盘価格が100日移動平均線を下に突破したとき,出場;または100日移動平均線を下に200日移動平均線を突破したとき,出場.
停止停止:移動停止と固定停止を設定する.
この戦略は,移動平均線が市場平均価格を効果的に判断する特性を利用し,短期平均線上での長期平均線の穿越は,市場が上昇傾向に踏み込む信号とみなされ,それにより多額を支払います.短期平均線下での長期平均線の穿越は,市場が下降方向に踏み込むチャネルとみなされ,それゆえオフになります.この方法で,市場傾向を効果的に捉えることができます.
戦略的優位性
操作がシンプルで実行しやすい. 戦略の論理は,3つの異なる周期の移動平均を使用して構築できます.
強い安定性がある.移動平均は,それ自体が消音機能を備えており,市場のランダムな波動が取引に影響を効果的に排除し,信号をより安定して信頼性のあるものにする.
大規模なトレンドを把握しやすい.移動平均は,市場平均価格の変化のトレンドを効果的に反映し,長短周期線の交差によって,大規模な市場変化を判断することができる.
カスタマイズ度が高い.移動平均の周期组合を自主的に決定し,異なるレベルのリスク管理を実現できる.
戦略リスク
偽信号が多く発生する可能性がある.短期と長期の移動平均があまりにも接近すると,頻繁に交差が起こり,大量に無効信号が発生する可能性がある.
突発事件に対する迅速な反応ができない.移動平均は価格変化に対する反応が遅い,市場の突発的なニュースや重大事件に対するリアルタイムな反応ができない.
市場における小規模な波動を利得に利用できない.移動平均の非ノイズ特性も,市場における小規模な波動を利得に利用できないことを意味する.
パラメータ設定は主観的である.移動平均周期の選択は主観的である.異なる市場に応じて最適なパラメータを決定する必要がある.
戦略最適化の方向性
フィルター条件を追加し,偽信号を過剰に発生させないようにする.例えば,価格変動の範囲をフィルターとして設定し,特定の幅度を破るときのみ取引信号を生成する.
他の指標と組み合わせる.例えば,波動率指標,交付量指標などと組み合わせて使用すると,信号の正確性が向上する.
適応最適化モジュールを追加する. 機械学習などの技術を使用して,移動平均の周期パラメータを動的に最適化して,外部市場環境の変化に適応できるようにする.
ディープラーニングモデルと組み合わせる.より高度なディープラーニングモデルで移動平均を置き換える.特征抽出とモデリングの能力がより強固である.
要約する
ゴールド・クロス・均等線取引戦略は,比較的典型的なトレンドフォロー戦略である.市場価格の平均変化の傾向を反映し,シンプルで実用的で,初心者向けに適している.同時に,この戦略には,信号品質の向上,他の技術指標との組み合わせ,より複雑な市場環境への適応のための自己適応メカニズムの導入など,複数の側面から最適化できるいくつかの欠陥がある.全体的に,この戦略は,高い参考値と学習価値を持っている.
/*backtest
start: 2023-12-03 00:00:00
end: 2023-12-10 00:00:00
period: 1m
basePeriod: 1m
exchanges: [{"eid":"Futures_Binance","currency":"BTC_USDT"}]
*/

// This source code is subject to the terms of the Mozilla Public License 2.0 at https://mozilla.org/MPL/2.0/
// © CJDeegan

//@version=4
strategy(title = "[LIVE] Golden Cross", overlay=true)

// ------------Functions------------

//Percent to Decimal Conversion
perToDec(a) => a * 0.01
//Price Difference to Tick
diffToTick(a,b) => (a - b) / syminfo.mintick


// ------------Strategy Inputs------------
takeProfitInput = input(300, "Take Profit Price (% Gain)")
stopLossInput = input(25, "Stop Loss (% Loss)")


startDate = input(title="Start Date", type=input.integer,
     defval=1, minval=1, maxval=31)
startMonth = input(title="Start Month", type=input.integer,
     defval=1, minval=1, maxval=12)
startYear = input(title="Start Year", type=input.integer,
     defval=2018, minval=1800, maxval=2100)

endDate = input(title="End Date", type=input.integer,
     defval=1, minval=1, maxval=31)
endMonth = input(title="End Month", type=input.integer,
     defval=1, minval=1, maxval=12)
endYear = input(title="End Year", type=input.integer,
     defval=2031, minval=1800, maxval=2100)

inDateRange = (time >= timestamp(syminfo.timezone, startYear,
         startMonth, startDate, 0, 0)) and
     (time < timestamp(syminfo.timezone, endYear, endMonth, endDate, 0, 0))


// ------------Populate Indicators------------

//EMA
sma50 = sma(close,50)
sma100 = sma(close,100)
sma200 = sma(close,200)


// ------------Entry Logic------------
//Guards
entryGuard = true
//Triggers
entryTrigger = crossover(sma50,sma100)
//Conditions
entryCondition = entryGuard and entryTrigger
//Calculations
//Execution
if (inDateRange and entryCondition)
    strategy.entry("Long", strategy.long, when = entryCondition, comment = "Entry")

//------------Exit Logic------------

//Guards
//Triggers
exitTrigger = crossunder(sma50,sma100) or close < sma100 or crossunder(sma100,sma200)
//Conditions
exitCondition = exitTrigger

//Calculations
//Take Profit
takeProfitPrice = strategy.position_avg_price + (strategy.position_avg_price * perToDec(takeProfitInput))
//Take Profit Ticks
takeProfitTicks = diffToTick(takeProfitPrice, strategy.position_avg_price)
//StopLoss
stopLossPrice = strategy.position_avg_price - (strategy.position_avg_price * perToDec(stopLossInput))

//Execution
if (inDateRange)
    strategy.close("Long", when = exitCondition, comment = "Sell Trigger")
    strategy.exit("Exit", "Long", comment="Stop", profit=takeProfitTicks, stop=stopLossPrice)

//Plots
plot(sma50, "SMA 50", color = color.blue)
plot(sma100, "SMA 100", color = color.green)
plot(sma200, "SMA 200", color = color.yellow)
entry = plot(strategy.position_size <= 0 ? na : strategy.position_avg_price, "Entry Price", color = color.yellow, style = plot.style_linebr)
profit = plot(strategy.position_size <= 0 ? na : takeProfitPrice, "Take Profit (Price)", color = color.green, style = plot.style_linebr)
stop = plot(strategy.position_size <= 0 ? na : stopLossPrice, "Stop Loss", color = color.red, style = plot.style_linebr)
fill(entry,profit, color=color.green)
fill(entry,stop, color=color.red)