EMAとATRストップロスに基づくトレンドフォロー戦略

1
Follow
1779
Followers
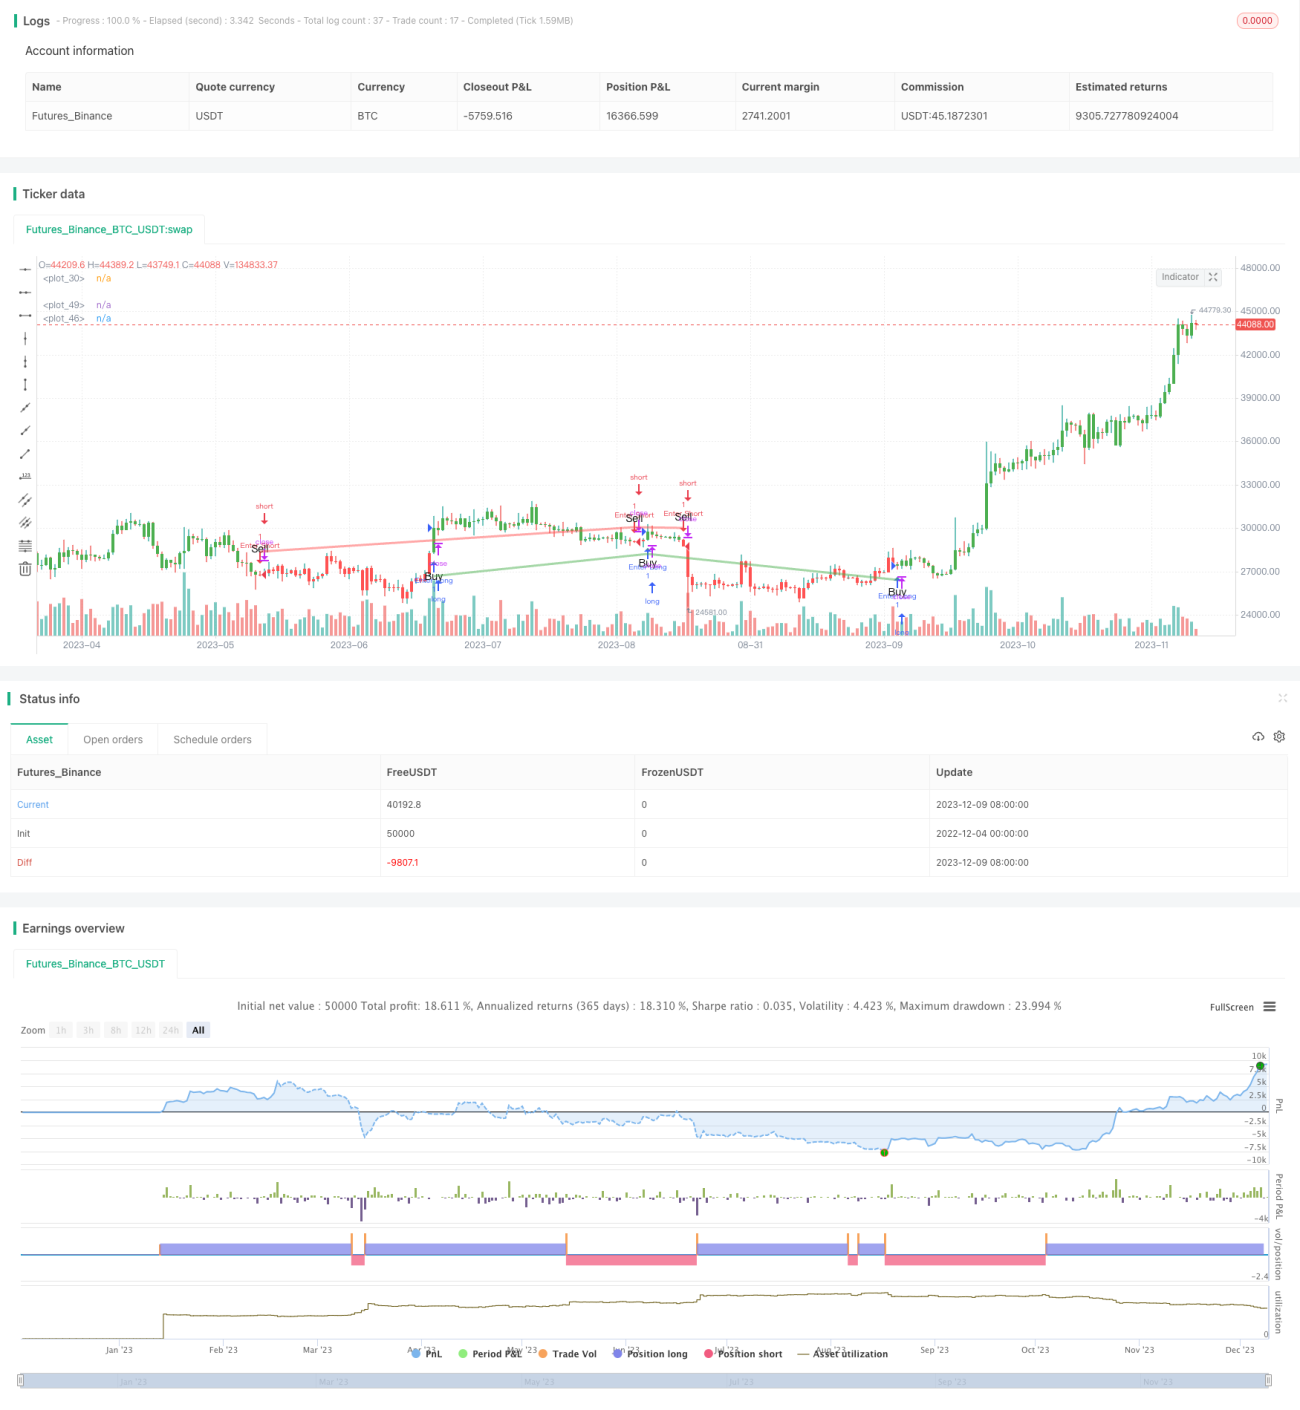
概要
この戦略は,EMA均線ゴールドクロスを採用して取引信号を生成する.つまり,高速EMA線を横断すると購入信号を生成し,高速EMA線を下に遅いEMA線を横断すると販売信号を生成する.これは典型的なトレンド追跡戦略の1つである.同時に,戦略はATR指標を使用して動的ストップロスを設定し,利益を保証しながらリスクを制御する.
戦略原則
- 定義 急速EMA平均線周期は13で,遅いEMA平均線周期は48である.
- 速いEMA線が遅いEMA線を穿越すると,買取信号が生じ,速いEMA線の下の遅いEMA線を穿越すると,売出信号が生じます.
- 均線金叉死叉は,ta.crossoverとta.crossunder関数によって判断する.
- ATR指標を用いて動的止損位を計算し,止損位距離はcloseの1.5倍ATR。
- 取引信号とストップポイントを,色変化,買取,販売の標識,ストップラインで直視的に表示します.
戦略的優位分析
- EMA平均線に基づく金叉デッドフォークは,市場の主要トレンドを逃さないようにシグナルを生成し,相当な利益が得られる.
- ATRのダイナミック・トラッキング・ストープは,充分な順位の利得を保証するとともに,撤回リスクをコントロールし,全体的なリスク・利益は均衡している.
- 直感的な信号表示と止損表示,操作が簡単で,ほとんどの人のために適しています.
- 調整可能なパラメータが少なく,習得し,最適化することが容易である.
戦略的リスク分析
- 突発的な出来事による暴落は,停止を誘発する可能性があります.
- 震動の際には,頻繁に無効信号が生じる可能性があります.
- パラメータを正しく設定しないことにより,過激なフィールドへの入り込みや過緩やかなストップダメージが発生する可能性があります.
- EMAパラメータとATRパラメータを適切に最適化する必要があります.
解決策は
- ATRの倍数を適当に緩和して,近年の高点からのストップダメージに緩衝を与える.
- シグナル発生後の確認メカニズム,例えば価格突破前の高点なども考慮できます.
- パラメータの最適化には,様々な市場の状況を全面的に考慮することが推奨されます.
戦略最適化の方向性
- 異なるパラメータの組み合わせをテストし,最適なパラメータを探します.
- 交信量指数,波動率指数などの他の指標を添加して信号フィルタリングを行うことは考えられる.
- EMAのパラメータは,大レベルのトレンドに合わせて調整され,主要なトレンドをよりよく捉えることができます.
- 動的にATRの止損倍数を調整し,トレンド状況で止損範囲を拡大することを考えることができます.
- 機械学習アルゴリズムと組み合わせた自適化最適化パラメータ.
要約する
この戦略は,全体的に比較的シンプルで使いやすい,EMA均線に基づいて信号を生成し,順番として,ATR指標のストップ追跡を補足して,リスクを効果的に制御できます.偽信号があるかもしれませんが,主要なトレンドを捕捉する能力は強い,収益は安定しており,量化取引の基本戦略の一つに適しています.パラメータの最適化と機能拡張によって改善の余地があり,深入研究に値します.
Source
Pine
/*backtest
start: 2022-12-04 00:00:00
end: 2023-12-10 00:00:00
period: 1d
basePeriod: 1h
exchanges: [{"eid":"Futures_Binance","currency":"BTC_USDT"}]
*/

// This source code is subject to the terms of the Mozilla Public License 2.0 at https://mozilla.org/MPL/2.0/
// © byee322

/// This strategy uses the EMA to generate buy and sell signals with a 1.5x ATR stop lossStrategy parameters
Related strategies
Comment
All comments (0)
No data
- 1