移動平均RSI相関暗号通貨トレンド戦略

概要
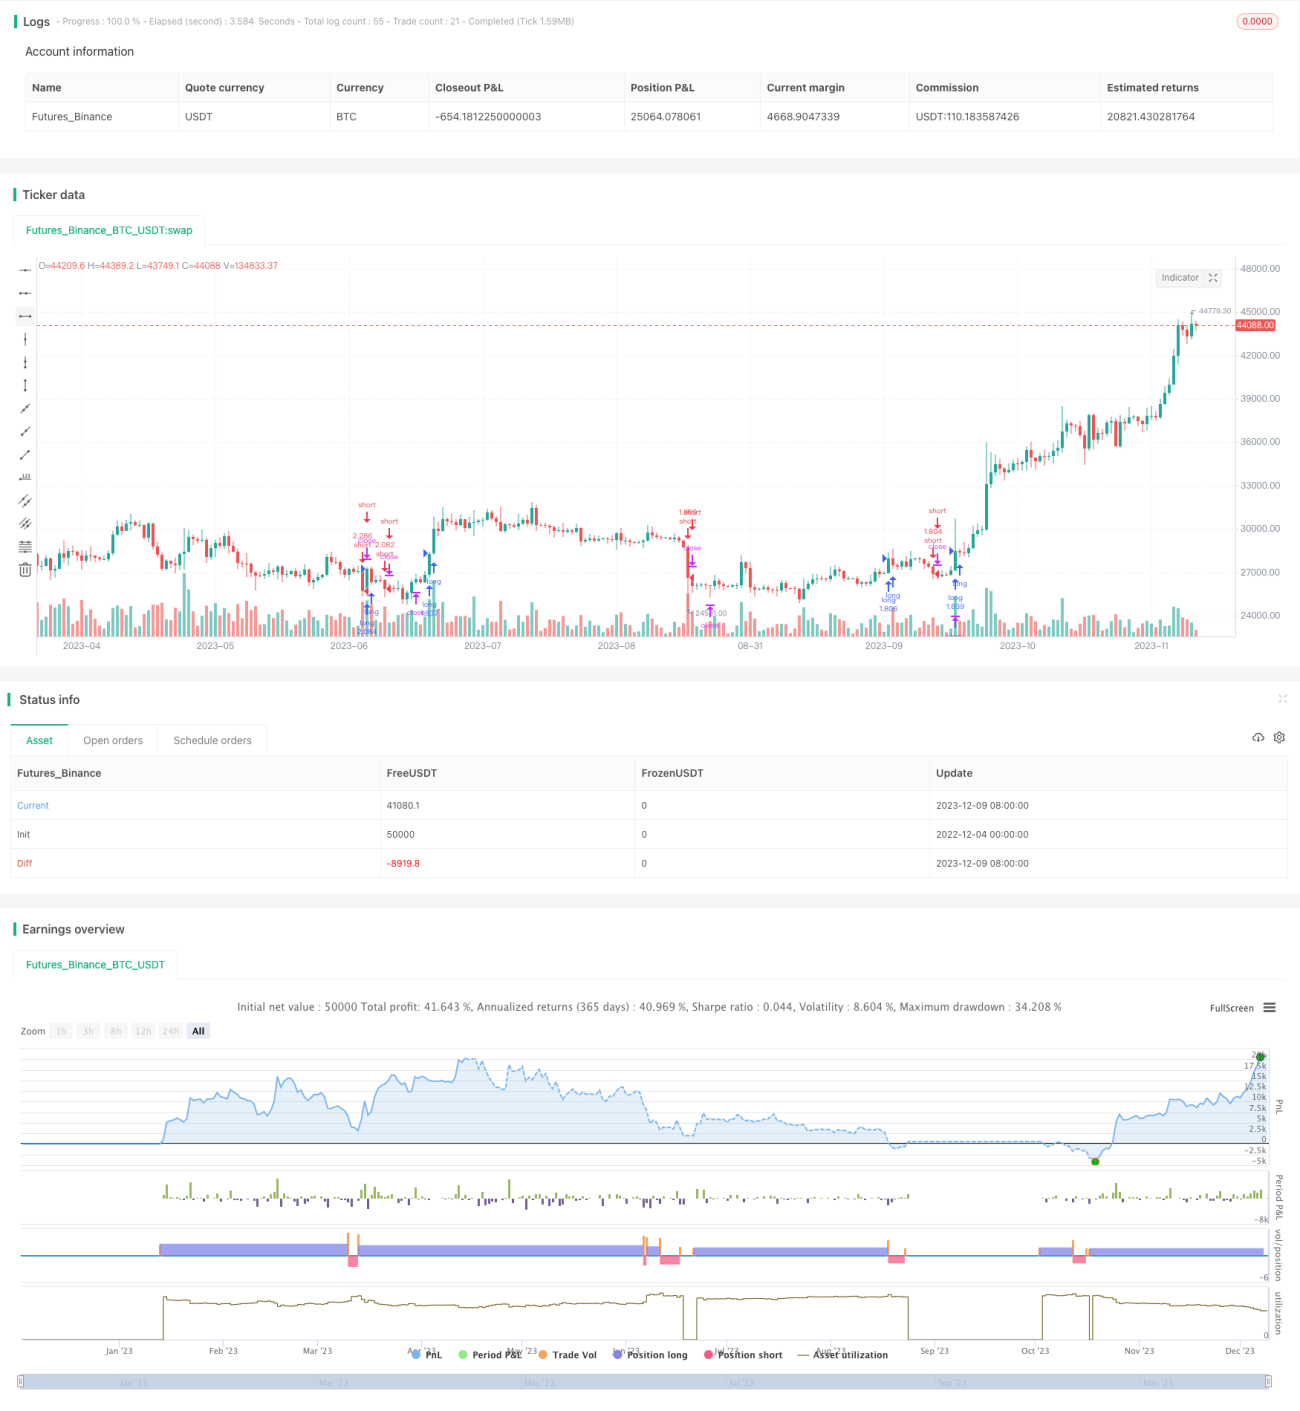
この戦略は,移動平均,相対的に強い指標 ((RSI)) と市場関連性の概念を組み合わせた長期間にわたる暗号通貨のトレンド追跡戦略であり,中長期の価格トレンドを識別し,トレンドの開始時にポジションを確立し,トレンドが進むにつれて徐々にポジションを上昇させ,トレンドの逆転シグナルを発見して停止することを目的としています.
戦略原則
この戦略は主に以下の3つの指標に基づいて判断されます.
-
比較的強い指標 ((RSI):超買超売現象を識別するために,RSIが51を超えると超買信号で,49を下ると超売信号である.
-
移動平均 ((SMA):トレンドの方向を判断する指標として,閉じる価格の9日間の単純な移動平均を計算する.
-
市場関連性:暗号通貨の総市場価値を基準行情として選択し,取引品種との関連性を計算し,取引品種自身のK線行情を関連性行情に置き換え,取引信号の効果を高める.
取引の具体的ルールは以下の通りです.
多頭入場:RSIが51を突破し,クローズ価格が9日SMAより高いときは多頭入場.
空頭入場:RSI下49を突破し,9日SMAより低い閉店価格で空頭;
ストップストラストの原則:多頭ストラストの設定は1%,ストラストの設定は0.1%;空頭ストラストの設定は0.05%,ストラストの設定は0.03%。
この戦略は同時に,指定された日付の範囲内での取引のみに時間条件を設定します.
優位分析
-
傾向と超買超売の指標を組み合わせて,中長期トレンドを効果的に追跡できます.
-
市場関連性を活用して信号の質を向上させ,単一品種の偽りのトレンドに惑わされないようにする.
-
自動ストップ・ストップ・損失の設定は合理的で,損失の拡大を防ぐ.
-
市場状況の異なる段階に対応するカスタマイズ可能な時間帯.
リスク分析
-
長期トレンド戦略は,短期トレンドの大きな波動に対応できない.
-
関連市場は,基準行情として,基準市場が転向したときに,取引品種が遅滞し,時効的に止まらない可能性がある.
-
余分な仕事や空き時間があれば 逆転のチャンスを逃すこともできます
対策として
-
KC,BOLLなどの他の短期指標と組み合わせて,市場段階を決定し,損失を抑える力を強化します.
-
基準の動きの分析を増加させ,基準の転換時に適時平仓を検出する.
-
双方向の品種を取引し,多空の機会を充分に捉える.
最適化の方向
-
パラメータ最適化:RSIパラメータ,移動平均パラメータ,ストップ・ストラスト幅を最適化して,戦略をより市場統計特性に合わせる.
-
取引品種最適化:より多くの可能な基準市場と取引品種を評価し,より高い関連性,よりよい流動性の組み合わせを選択する.
-
策略組合せ:他の策略組合せと併用して,大周期で市場の傾向の方向を判断しながら,この策略を利用して中長期線を保持する.
要約する
この戦略は,全体として,空間が広い,適用範囲が広い中長期線暗号通貨のトレンド追跡戦略である.これは,トレンド,オーバーバイ,オーバーセールと関連性判断を効果的に組み合わせて取引決定の質を向上させ,パラメータ調整と組み合わせを使用して戦略の安定性と収益率を大幅に向上させることができる.中長期にわたって保持される取引方法は,暗号通貨のこの波動が大きい,短線が正確なトレンドを捕捉することが難しい種にも適しています.
- 1