価格の極値に基づくトレンド取引戦略

概要
この戦略は,一定の周期内の価格の極小値点と極大値点を計算することによって,上下軌道を形成し,現在の価格が上下軌道上にあるか判断し,長ポジションまたは短ポジション操作を行う.戦略は,主に価格の傾向性を判断し,傾向が強まったときに取引する.
戦略原則
この戦略の核心指標は,一定の周期における価格の極小値点と極小値点を計算することである.具体的計算方法は以下の通りである.
上線:左から右のスキャン周期内のK線で,極大値の高点を見つけ,その左側の1根K線が極左まで,そして右側の1根K線が極右まで,その極大値の高点より低いかどうかを判断し,もしそうなら,その点を区間の頂点として確認する.
下線:左から右のスキャン周期内のK線を,極小値の低点を見つけ,その左側の1根K線が極左まで,右側の1根K線が極小値の低点より高いかどうかを判断し,もしそうなら,その点を区間の底点として確認する.
このような計算を繰り返すことで,一定の周期内における価格の上下軌道が得られる。価格が上上軌道に乗るときは多し,下下軌道に乗るときは空にする。このようにして,価格の極限点に基づいてトレンドを判定する取引戦略が形成される。
優位分析
この戦略は,原始的な直接的な傾向判断方法により,価格の極値判断により,トレンドの強化された部分によって,震動のシナリオを効果的にフィルターし,震動中の取引を避けることができる.戦略取引シグナルが生じる位置は,トレンド追跡が形成されやすい.さらに,戦略の信号の取り方は,より厳格であり,誤信号を減らすことができる.
リスク分析
この策略は,より厳格な信号を取って,より多くの取引機会を逃す可能性があります.さらに,極限点は一定時間蓄積して形成され,比較遅れになり,適切な最適化パラメータが必要になります.パラメータがタイミングが悪い場合,誤った信号が生じる可能性が高いです.
極限点判断の厳しさを適当に軽減し,一定程度の波動を許容することで,誤判のリスクを減らすことができる。さらに,他の指標と組み合わせて確認することができ,誤信号を避ける。
最適化の方向
この戦略は,上下を判断する周期を適切に最適化して,トレンドをよりよく捉えることができる.さらに,極限点を判断する時のスキャン区間も調整できる.
取引の機会を逃す可能性を減らすために,極限値の判断条件を適正に緩和し,一定量の変動を許容することができる.
他の指標,例えば量能指標,移動平均などと組み合わせて確認を試みることができる.単一の指標判断によって生じる誤信号のリスクを避ける.
要約する
この戦略は,価格の極限点を経由して価格トレンドの特徴を判断する方法で比較的直接的に有効であり,揺れを効果的にフィルターし,トレンドが強化されるタイミングを判断してトレンド取引を行うことができる.戦略の優点は,シグナルが生じる位置が良いことであり,トレンドを捕まえることができる点にある.欠点は,シグナルが比較的遅れて,転換を捕まえることが難しい点にある.パラメータおよび条件の最適化により,この戦略は,より信頼性の高いトレンド判断ツールになることができる.
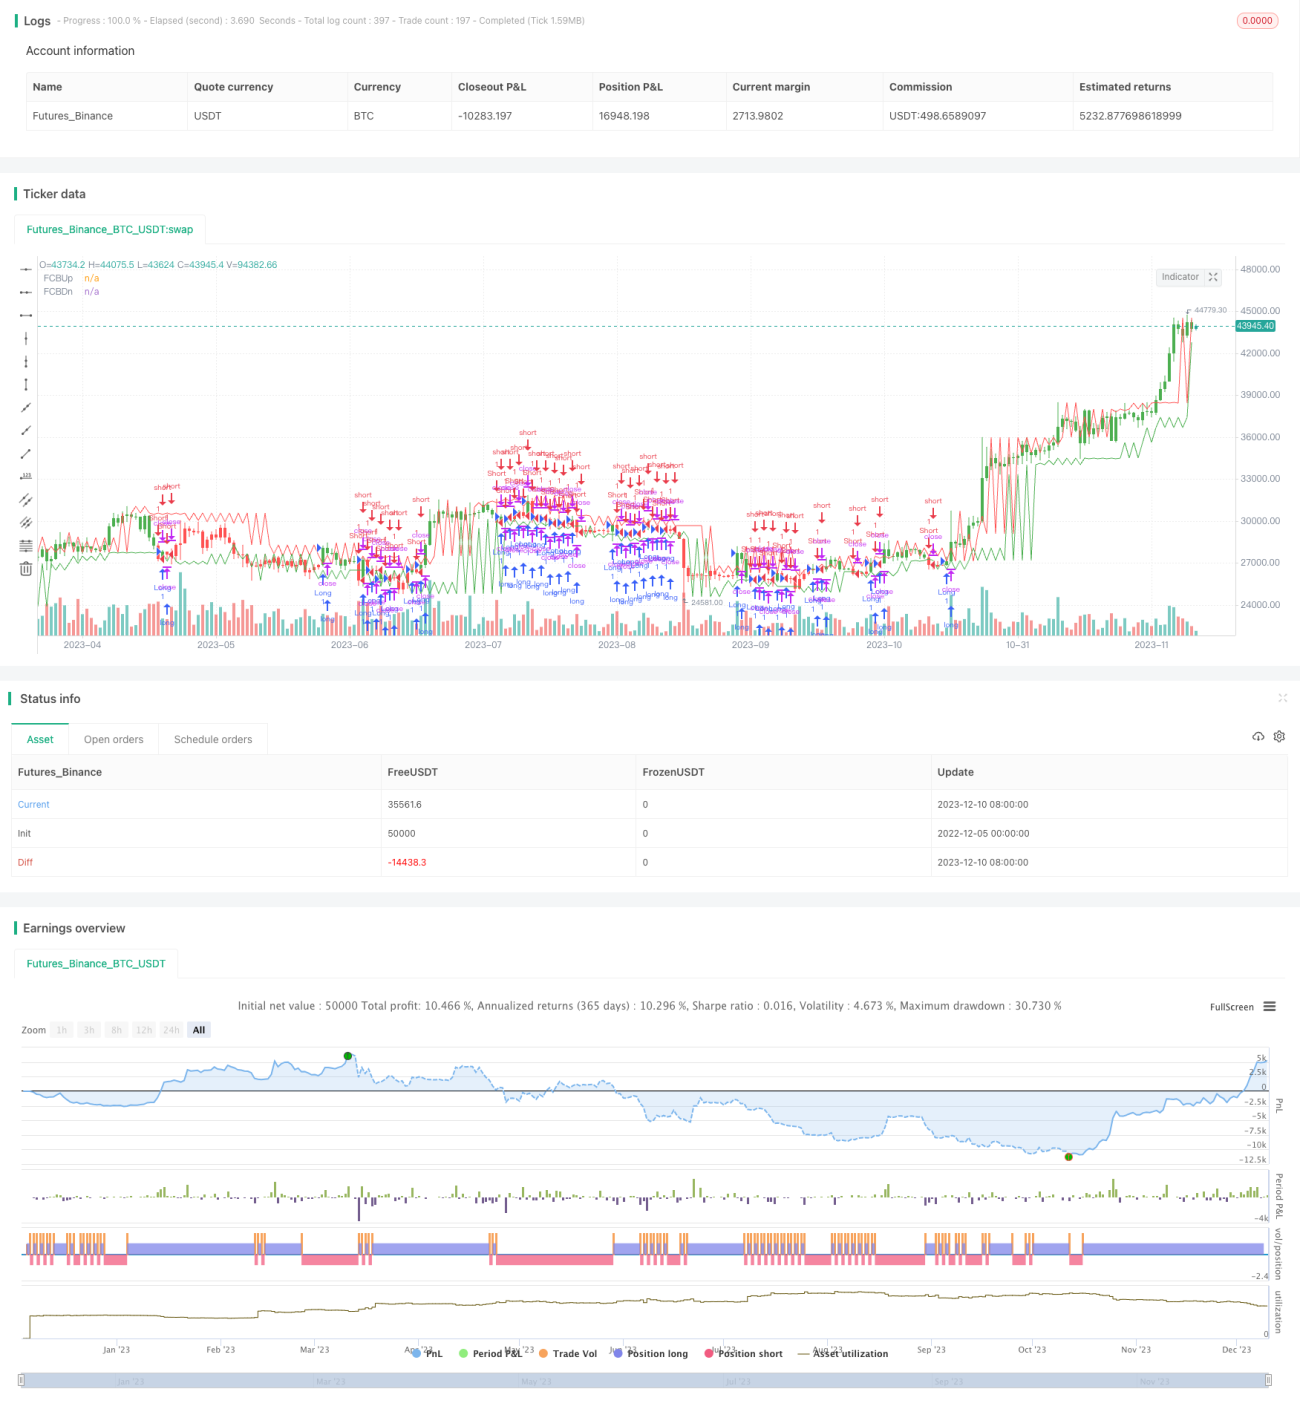
/*backtest
start: 2022-12-05 00:00:00
end: 2023-12-11 00:00:00
period: 1d
basePeriod: 1h
exchanges: [{"eid":"Futures_Binance","currency":"BTC_USDT"}]
*/

//@version=2
////////////////////////////////////////////////////////////
//  Copyright by HPotter v1.0 19/02/2018
// Stock market moves in a highly chaotic way, but at a larger scale, the movements - 1