ダウ理論に基づくRSI/MFIモメンタム指標戦略

1
Follow
1779
Followers
概要
この戦略は,相対的に強弱な指標 ((RSI) または資金流動指標 ((MFI) を用いて,市場をブルまたはベアと判断し,ダウ氏理論のブル・ベア係数と組み合わせて,調整された確率分布を計算する.異なる市場タイプに応じて,異なる入場と出場ロジックを使用する.
戦略原則
- RSIまたはMFIを計算して,市場が現在どのような状態にあるかを判断します.
- ダウシュ理論の牛熊係数を計算し,現在の価格と取引量との関連性を反映する
- RSI/MFIの確率分布を調整し,正確な多空分布を決定する
- 現在セッションIDと確率に基づいて入学かどうかを判断する
- 利益の撤回や市場の整合時にストップ・損失
優位分析
- 市場を正確に判断する道氏理論
- 盲目入学を避けるために 整合要素を考慮する
- 利回り高 撤回低
リスク分析
- パラメータが正しくない場合,誤判が多発する.
- 十分な歴史データが必要です
- ストップダストロジックは単純で,特殊な状況に最適化できません.
最適化の方向
- 市場セッションの判断は,他の指標と組み合わせて考えられます.
- 波動率,歴史データなどのより厳格なストップ・ロジックを追加
- 機械学習などで より良いパラメータを特定できます
要約する
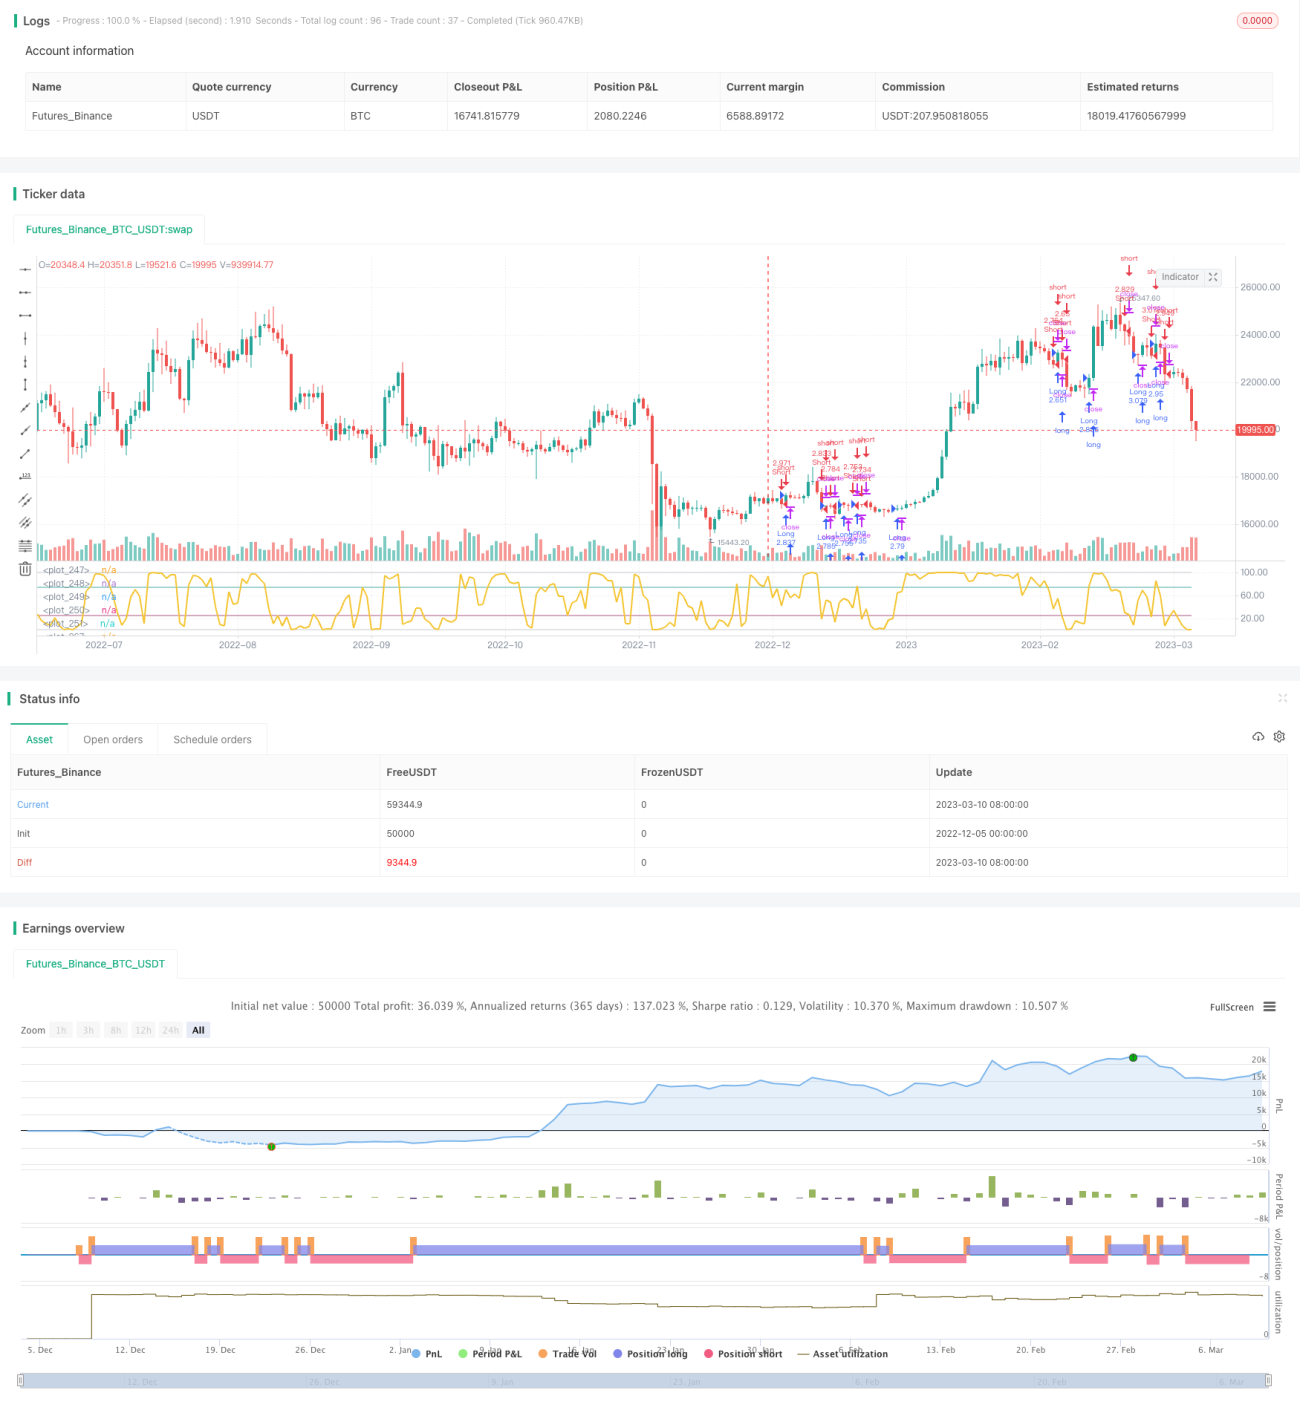
この戦略は,全体的に反測結果が良好で,一定の実戦価値がある。しかし,さらにテストと調整が必要であり,特に止損論理が必要である。補助的な判断指標として使用すると効果がより良く,盲目追従はできない。
Source
Pine
Strategy parameters
Related strategies
Comment
All comments (0)
No data
- 1