揮発性に基づく有限体積要素戦略


作成日: 2023-12-19 15:23:59 最終変更日: 2023-12-19 15:23:59
コピー: 0 クリック数: 722
1
フォロー
1621
フォロワー

揮発性に基づく有限体積要素戦略

概要

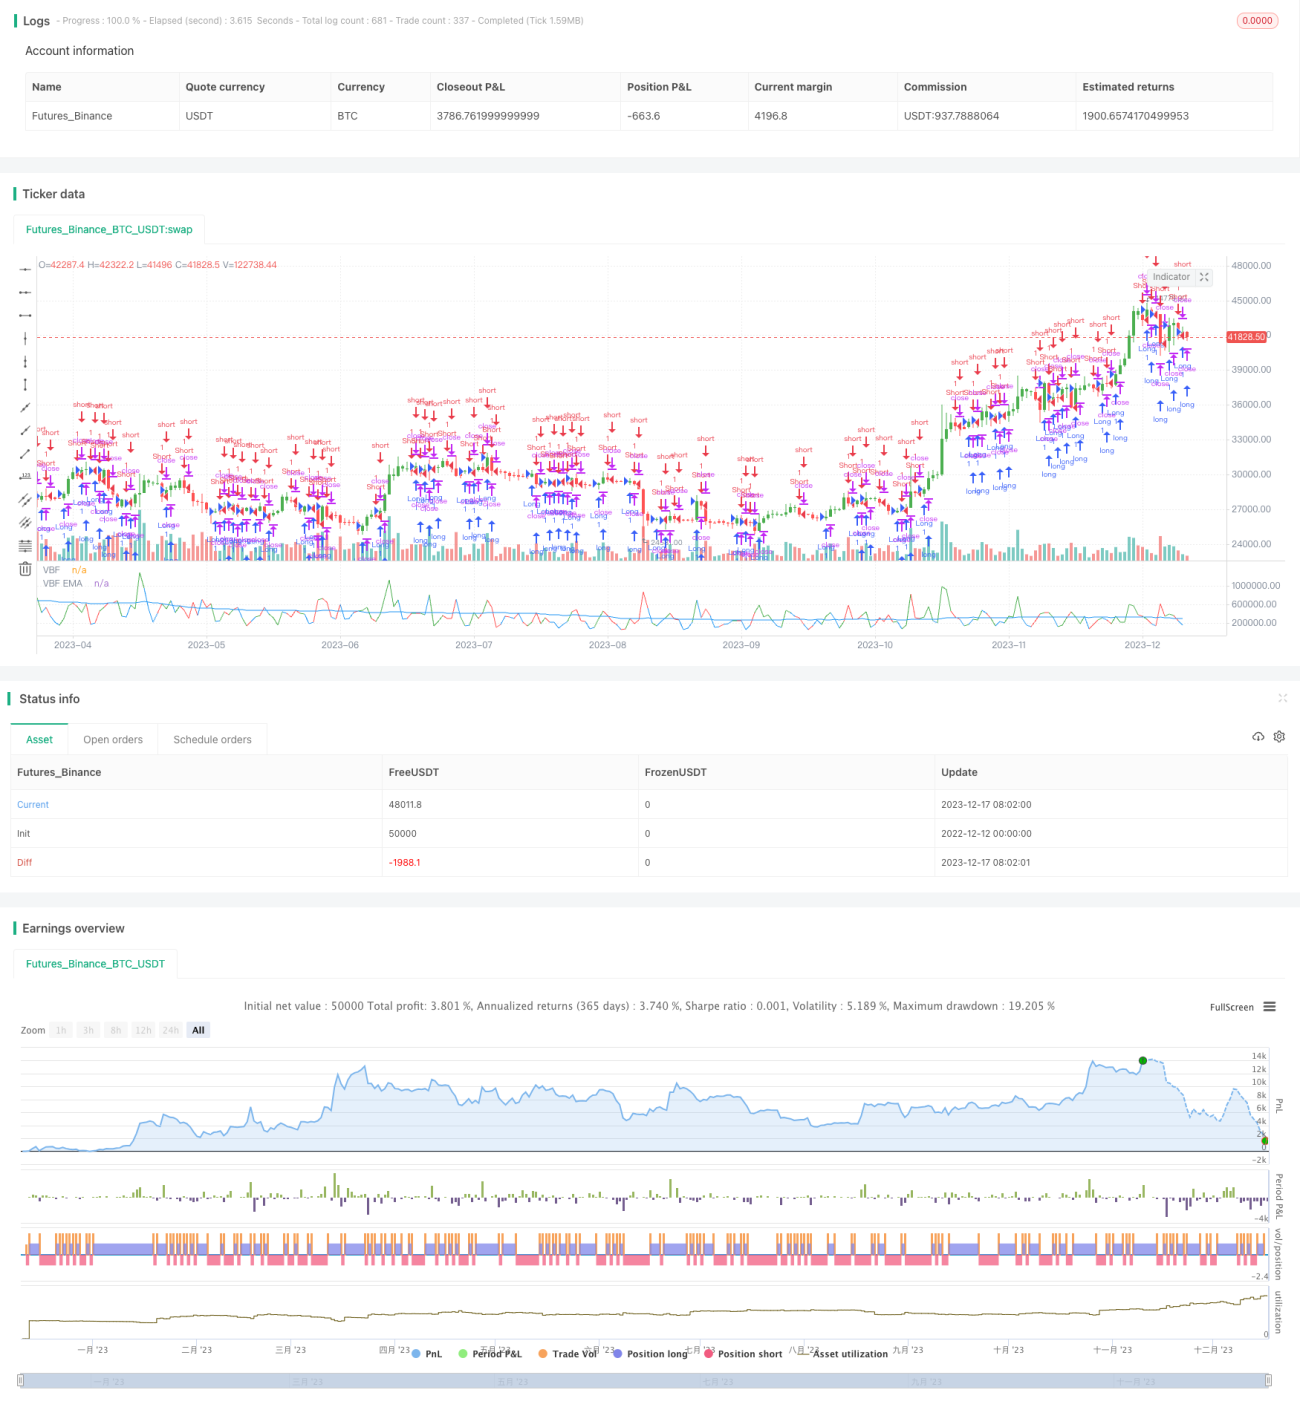
この戦略は,限られた取引量 (FVE) 指数に基づく改良である.FVEは純取引量指数であり,価格の変化を考慮せず,資金の流入と流出のみを重視する.この戦略は,市場情緒と資金の流れを判断するために,変動率に基づいて取引量を色分けする.

戦略原則

この戦略は,日中の変動率を計算します.Intra日間変動率Inter標準差を組み合わせたVintraそしてVinter変動率の値を取得します.CutOff┃ ┃ ┃ ┃ ┃MF資金の流入を判断する (正値) または流出を判断する (負値).MF超えられるCutOff取引量と波動率の同向性,市場が熱意に溢れている,緑色で示します.MF負のより低いCutOff取引量と波動率の同向性,市場の明らかな悲観性,色は赤に設定されている.そうでない場合は,色は青に設定されている.

優位分析

この戦略は,取引量と変動率の2つの指標を組み合わせて,市場情勢をより正確に判断することができる.単一の指標と比較して,判断の安定性と信頼性の利点がある.また,この戦略の判断基準は,変動率を対象に特別に設計され,異なる状況の変化にうまく適応することができる.

リスク分析

この戦略は取引量と波動率の指標に依存し,両方が相違すると判断に影響する.さらに,パラメータ設定は結果に影響が大きく,異なる品種とパラメータの組み合わせの効果は大きく異なっており,ターゲットに最適化が必要である.

最適化の方向

取引量や変動率による騒音を避けるために,MACD,OBVなどの他の指標の補助判断と組み合わせて考えることができる.さらに,異なる状況の動態に応じてパラメータを調整し,安定性を高めるために,自己適応のパラメータメカニズムを設計することができる.または,特定の品種に対して,最適のパラメータの組み合わせを見つけるために,リターン・オプティマイズすることができる.

要約する

この戦略は,取引量と波動率指標の優位性を統合し,市場熱意の高低を判断する.単一の指標と比較して,判断の正確性と安定性の高い.しかし,パラメータ設定と品種差が結果に影響を及ぼし,複数の取引環境に対応するためにさらなる最適化調整が必要である.全体的に,この戦略の理論的基盤は合理的で,大きな改善の可能性がある.

ストラテジーソースコード
/*backtest
start: 2022-12-12 00:00:00
end: 2023-12-18 00:00:00
period: 1d
basePeriod: 1h
exchanges: [{"eid":"Futures_Binance","currency":"BTC_USDT"}]
*/

//@version=2
////////////////////////////////////////////////////////////
//  Copyright by HPotter v1.0 22/08/2017
// The FVE is a pure volume indicator. Unlike most of the other indicators 
// (except OBV), price change doesn?t come into the equation for the FVE 
// (price is not multiplied by volume), but is only used to determine whether 
// money is flowing in or out of the stock. This is contrary to the current trend 
// in the design of modern money flow indicators. The author decided against a 
// price-volume indicator for the following reasons:
// - A pure volume indicator has more power to contradict.
// - The number of buyers or sellers (which is assessed by volume) will be the same, 
// regardless of the price fluctuation.
// - Price-volume indicators tend to spike excessively at breakouts or breakdowns.
// This study is an addition to FVE indicator. Indicator plots different-coloured volume 
// bars depending on volatility.
//
// You can change long to short in the Input Settings
// Please, use it only for learning or paper trading. Do not for real trading.
////////////////////////////////////////////////////////////
strategy(title="Volatility Finite Volume Elements Strategy", shorttitle="FVI")
Samples = input(22, minval=1)
AvgLength = input(50, minval=1)
AlertPct = input(70, minval=1)
Cintra = input(0.1, step = 0.1)
Cinter = input(0.1, step = 0.1)
reverse = input(false, title="Trade reverse")
xVolume = volume
xClose = close
xhl2 = hl2
xhlc3 = hlc3
xMA = sma(xVolume, AvgLength)
xIntra = log(high) - log(low)
xInter = log(xhlc3) - log(xhlc3[1])
xStDevIntra = stdev(xIntra, Samples)
xStDevInter = stdev(xInter, Samples)
TP = xhlc3
TP1 = xhlc3[1]
Intra = xIntra
Vintra = xStDevIntra
Inter = xInter
Vinter = xStDevInter
CutOff = Cintra * Vintra + Cinter * Vinter
MF = xClose - xhl2 + TP - TP1
clr = iff(MF > CutOff * xClose, green, 
             iff(MF < -1 * CutOff * xClose, red,  blue))
pos = iff(MF > CutOff * xClose, 1,
	   iff(MF < -1 * CutOff * xClose, -1, nz(pos[1], 0))) 
possig = iff(reverse and pos == 1, -1,
          iff(reverse and pos == -1, 1, pos))	   
if (possig == 1) 
    strategy.entry("Long", strategy.long)
if (possig == -1)
    strategy.entry("Short", strategy.short)	   	    
barcolor(possig == -1 ? red: possig == 1 ? green : blue )           
plot(xVolume, color=clr, title="VBF")
plot(xMA, color=blue, title="VBF EMA")