
震動波動優良指数取引戦略は,ビル・ウィリアムズが著書『新取引の次元』で提唱した提案に基づいて開発された量的な取引戦略である.この戦略は,急速な移動平均と遅い移動平均の差値を使用して震動指数を構築し,柱状図の形式で表示され,柱状図の色の変化によって取引信号を発信する.
この戦略の核心指標は,震動波動優良指標である『Awesome Oscillator (AO) 』で,計算式は以下の通りである.
AO = SMA(Median Price, Fast Length) - SMA(Median Price, Slow Length)
中央価格は高価格と低価格の平均値で,Fast Lengthは高速移動平均の周期長さを表し,Slow Lengthは遅い移動平均の周期長さを表しています.
AO指数は,速動平均と遅動平均の差値によって,市場価格が異なる時間尺度で変動する状況を反映します. 速動平均が遅動平均より高いときは,短期価格の力が長期価格の力より強いことを代表し,買入シグナル; 速動平均が遅動平均より低いときは,短期価格の力が長期価格の力より弱いことを代表し,売出シグナルです.
この策略は,AO指標の現在の値と前の周期の差値を使用して,現在の周期の多空状態を判断し,柱状図で異なる色で標識する:現在のAO値は前の周期より大きいとき,青色で,購入に適したことを示し;現在のAO値は前の周期より小さいとき,赤色で,販売に適したことを示します.
この戦略の利点は以下の通りです.
この戦略にはいくつかのリスクがあります.
上記のリスクを軽減するために,パラメータの設定を最適化し,指標の構築方法を調整し,他の指標で補足的に検証することができます.
この戦略は以下の点で最適化できます.
概要として,震動波動優良指標取引戦略は,価格傾向の変化を判断するために,速速な移動平均の差を活用し,短期的な逆転の機会を効果的に検出できます.この戦略の概念は明確で,実行しやすいもので,パラメータ最適化および他の指標と組み合わせることで,より良い取引効果が得られることが期待されます.
/*backtest
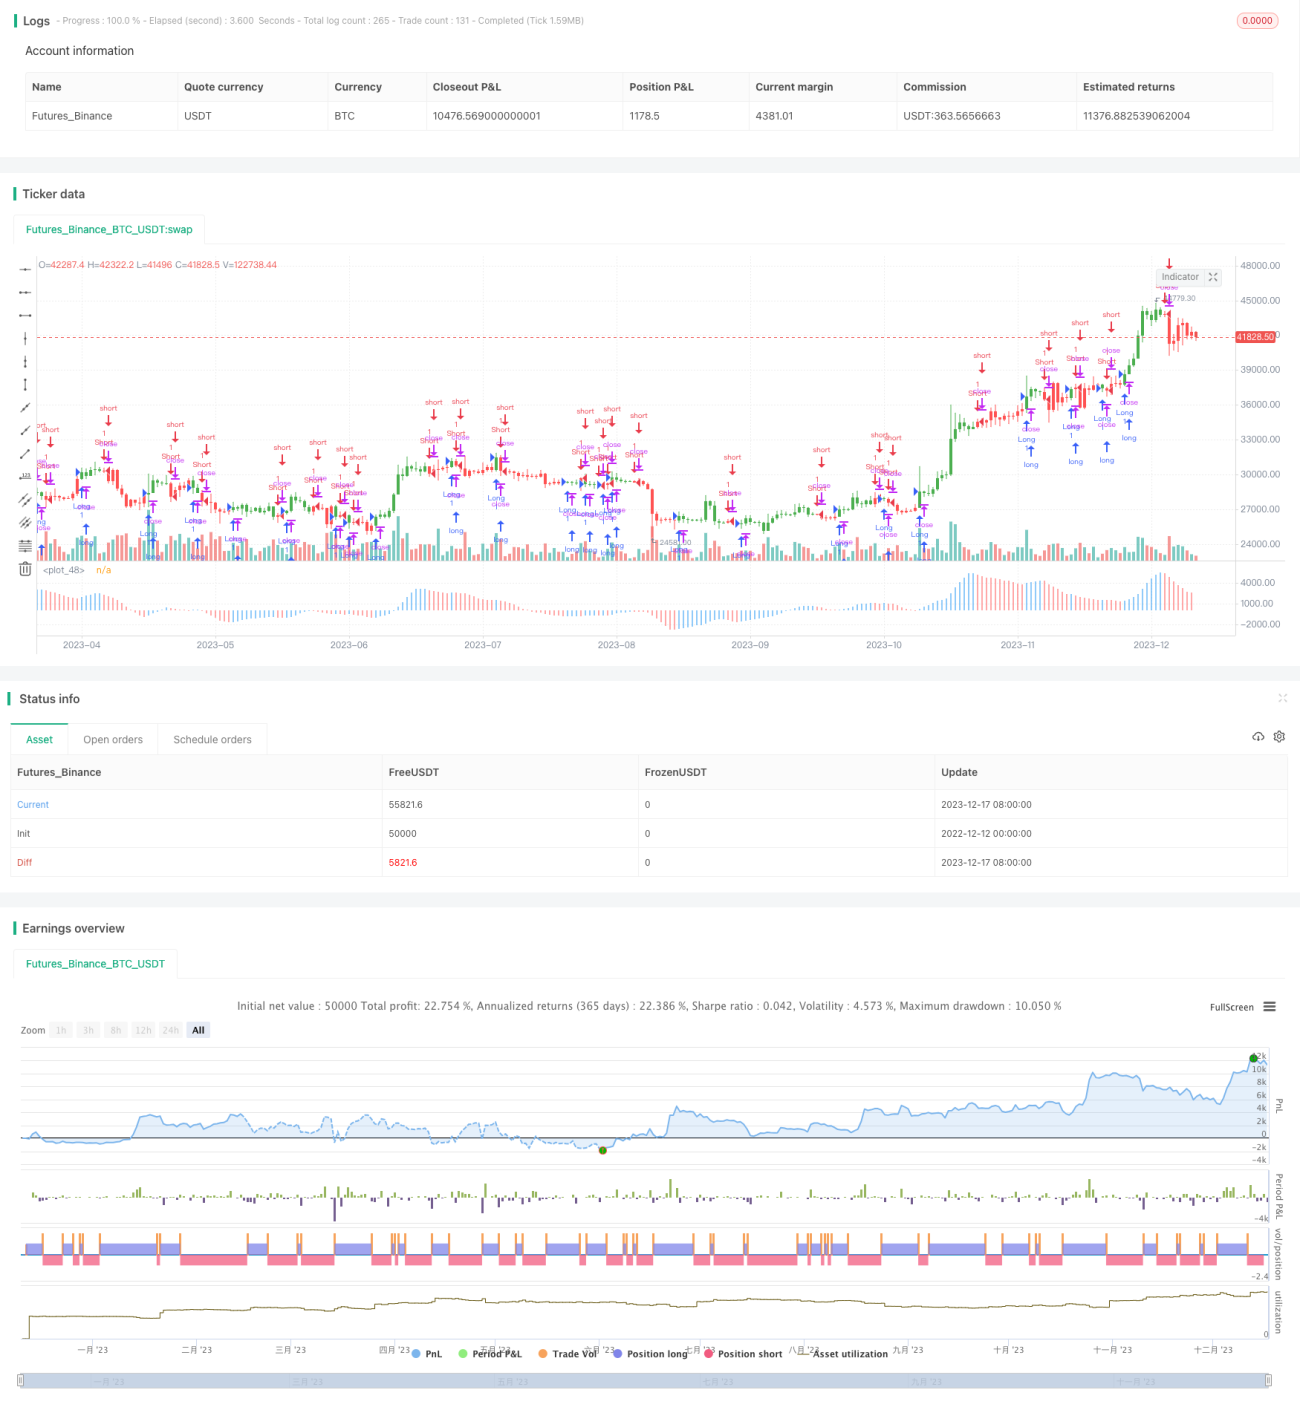
start: 2022-12-12 00:00:00
end: 2023-12-18 00:00:00
period: 1d
basePeriod: 1h
exchanges: [{"eid":"Futures_Binance","currency":"BTC_USDT"}]
*/
//@version=2
////////////////////////////////////////////////////////////
// Copyright by HPotter v1.0 29/12/2016
// This indicator is based on Bill Williams` recommendations from his book
// "New Trading Dimensions". We recommend this book to you as most useful reading.
// The wisdom, technical expertise, and skillful teaching style of Williams make
// it a truly revolutionary-level source. A must-have new book for stock and
// commodity traders.
// The 1st 2 chapters are somewhat of ramble where the author describes the
// "metaphysics" of trading. Still some good ideas are offered. The book references
// chaos theory, and leaves it up to the reader to believe whether "supercomputers"
// were used in formulating the various trading methods (the author wants to come across
// as an applied mathemetician, but he sure looks like a stock trader). There isn't any
// obvious connection with Chaos Theory - despite of the weak link between the title and
// content, the trading methodologies do work. Most readers think the author's systems to
// be a perfect filter and trigger for a short term trading system. He states a goal of
// 10%/month, but when these filters & axioms are correctly combined with a good momentum
// system, much more is a probable result.
// There's better written & more informative books out there for less money, but this author
// does have the "Holy Grail" of stock trading. A set of filters, axioms, and methods which are
// the "missing link" for any trading system which is based upon conventional indicators.
// This indicator plots the oscillator as a histogram where periods fit for buying are marked
// as blue, and periods fit for selling as red. If the current value of AC (Awesome Oscillator)
// is over the previous, the period is deemed fit for buying and the indicator is marked blue.
// If the AC values is not over the previous, the period is deemed fir for selling and the indicator
// is marked red.
//
// You can change long to short in the Input Settings
// Please, use it only for learning or paper trading. Do not for real trading.
////////////////////////////////////////////////////////////
strategy("Bill Williams. Awesome Oscillator (AO)")
nLengthSlow = input(34, minval=1, title="Length Slow")
nLengthFast = input(5, minval=1, title="Length Fast")
reverse = input(false, title="Trade reverse")
xSMA1_hl2 = sma(hl2, nLengthFast)
xSMA2_hl2 = sma(hl2, nLengthSlow)
xSMA1_SMA2 = xSMA1_hl2 - xSMA2_hl2
cClr = xSMA1_SMA2 > xSMA1_SMA2[1] ? blue : red
pos = iff(xSMA1_SMA2 > xSMA1_SMA2[1], 1,
iff(xSMA1_SMA2 < xSMA1_SMA2[1], -1, nz(pos[1], 0)))
possig = iff(reverse and pos == 1, -1,
iff(reverse and pos == -1, 1, pos))
if (possig == 1)
strategy.entry("Long", strategy.long)
if (possig == -1)
strategy.entry("Short", strategy.short)
barcolor(possig == -1 ? red: possig == 1 ? green : blue )
plot(xSMA1_SMA2, style=histogram, linewidth=1, color=cClr)