MA/VWAPクロスオーバーに基づく柔軟なストップロスおよびテイクプロフィット戦略

1
Follow
1779
Followers
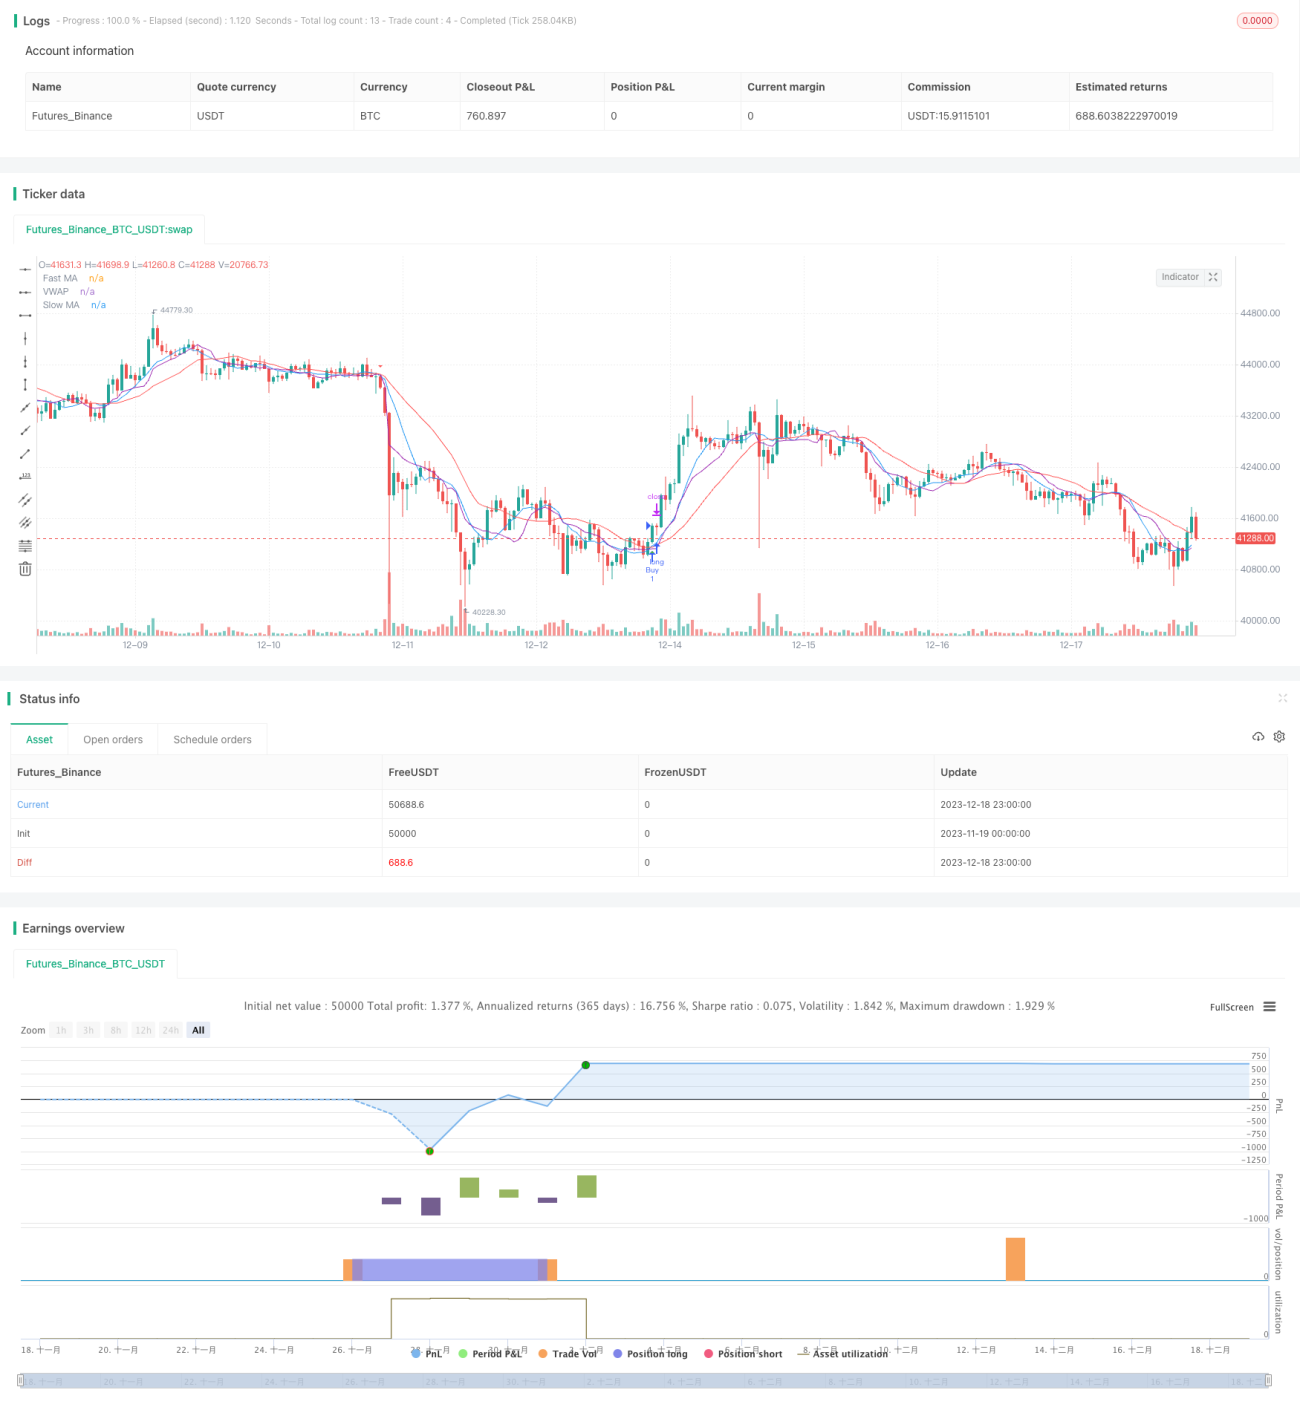
概要
この策略は,速動平均,遅動平均,交差量加重平均を計算して,それらの間の交差信号を識別して,価格の動きを捉えます. 速いMAがVWAPと遅いMAを上から下を通るとき,買い信号を生じ,速いMAがVWAPと遅いMAを上から下を通るとき,売り信号を生じ.
戦略原則
この戦略は,移動平均と取引量重加平均価格の優位性を組み合わせている.移動平均は,トレンド方向を判断するために,市場騒音を効果的にフィルターすることができる.取引量重加平均は,大資本の意図をより正確に反映することができる.急速なMAは,短期トレンドを捕捉し,遅いMAは,偽の信号をフィルターすることができる.
優位分析
- ダブルMAフィルターで偽信号を減らす
- VWAPは,大資金の意図を正確に判断する
- 柔軟に設定MAパラメータ,異なる周期に対応
- ストップ・ストップと組み合わせたリスク管理
リスク分析
- 市場が大きく揺れ動いた場合,複数の誤信号が発生する可能性があります.
- VWAPのパラメータ設定が正しく設定されていない場合
- ストップポイントから近すぎるとトレンドは追いつけないし,遠すぎるとリスクが大きい.
最適化の方向
- MAとVWAPのパラメータを最適化して,異なる状況に適応する
- RSIなどの他の指標と組み合わせたシグナルフィルター
- 動的に調整するストップ・ローズ・ストップ比率
要約する
この戦略は,移動平均とVWAPの優位性を統合し,二重フィルタリングによる交差信号の識別,柔軟な止損停止メカニズムと組み合わせて,リスクを効果的に制御することができ,推奨されるトレンド追跡戦略です.
Source
Pine
Strategy parameters
Related strategies
Comment
All comments (0)
No data
- 1