トリプルスーパートレンド移動平均ブレイクアウト戦略
概要
三重超トレンド平均線突破策は,複数の異なるパラメータ設定の超トレンド平均線と定義するトレンドのEMAを使用してトレンドの方向を識別し,取引する比較的一般的な策である.この策の主要な考えは,少なくとも2つの超トレンド平均線が定義するトレンドのEMA線の上部に多頭状態を示すときに多頭状態を確立すること;少なくとも2つの超トレンド平均線が定義するトレンドのEMA線の下部に空頭状態を示すときに空頭状態を確立することである.
戦略原則
この戦略は,3つの異なるパラメータの超トレンド平均線と,大きなトレンドの方向を定義するEMAを設定して,ポジションとポジションを判断します.
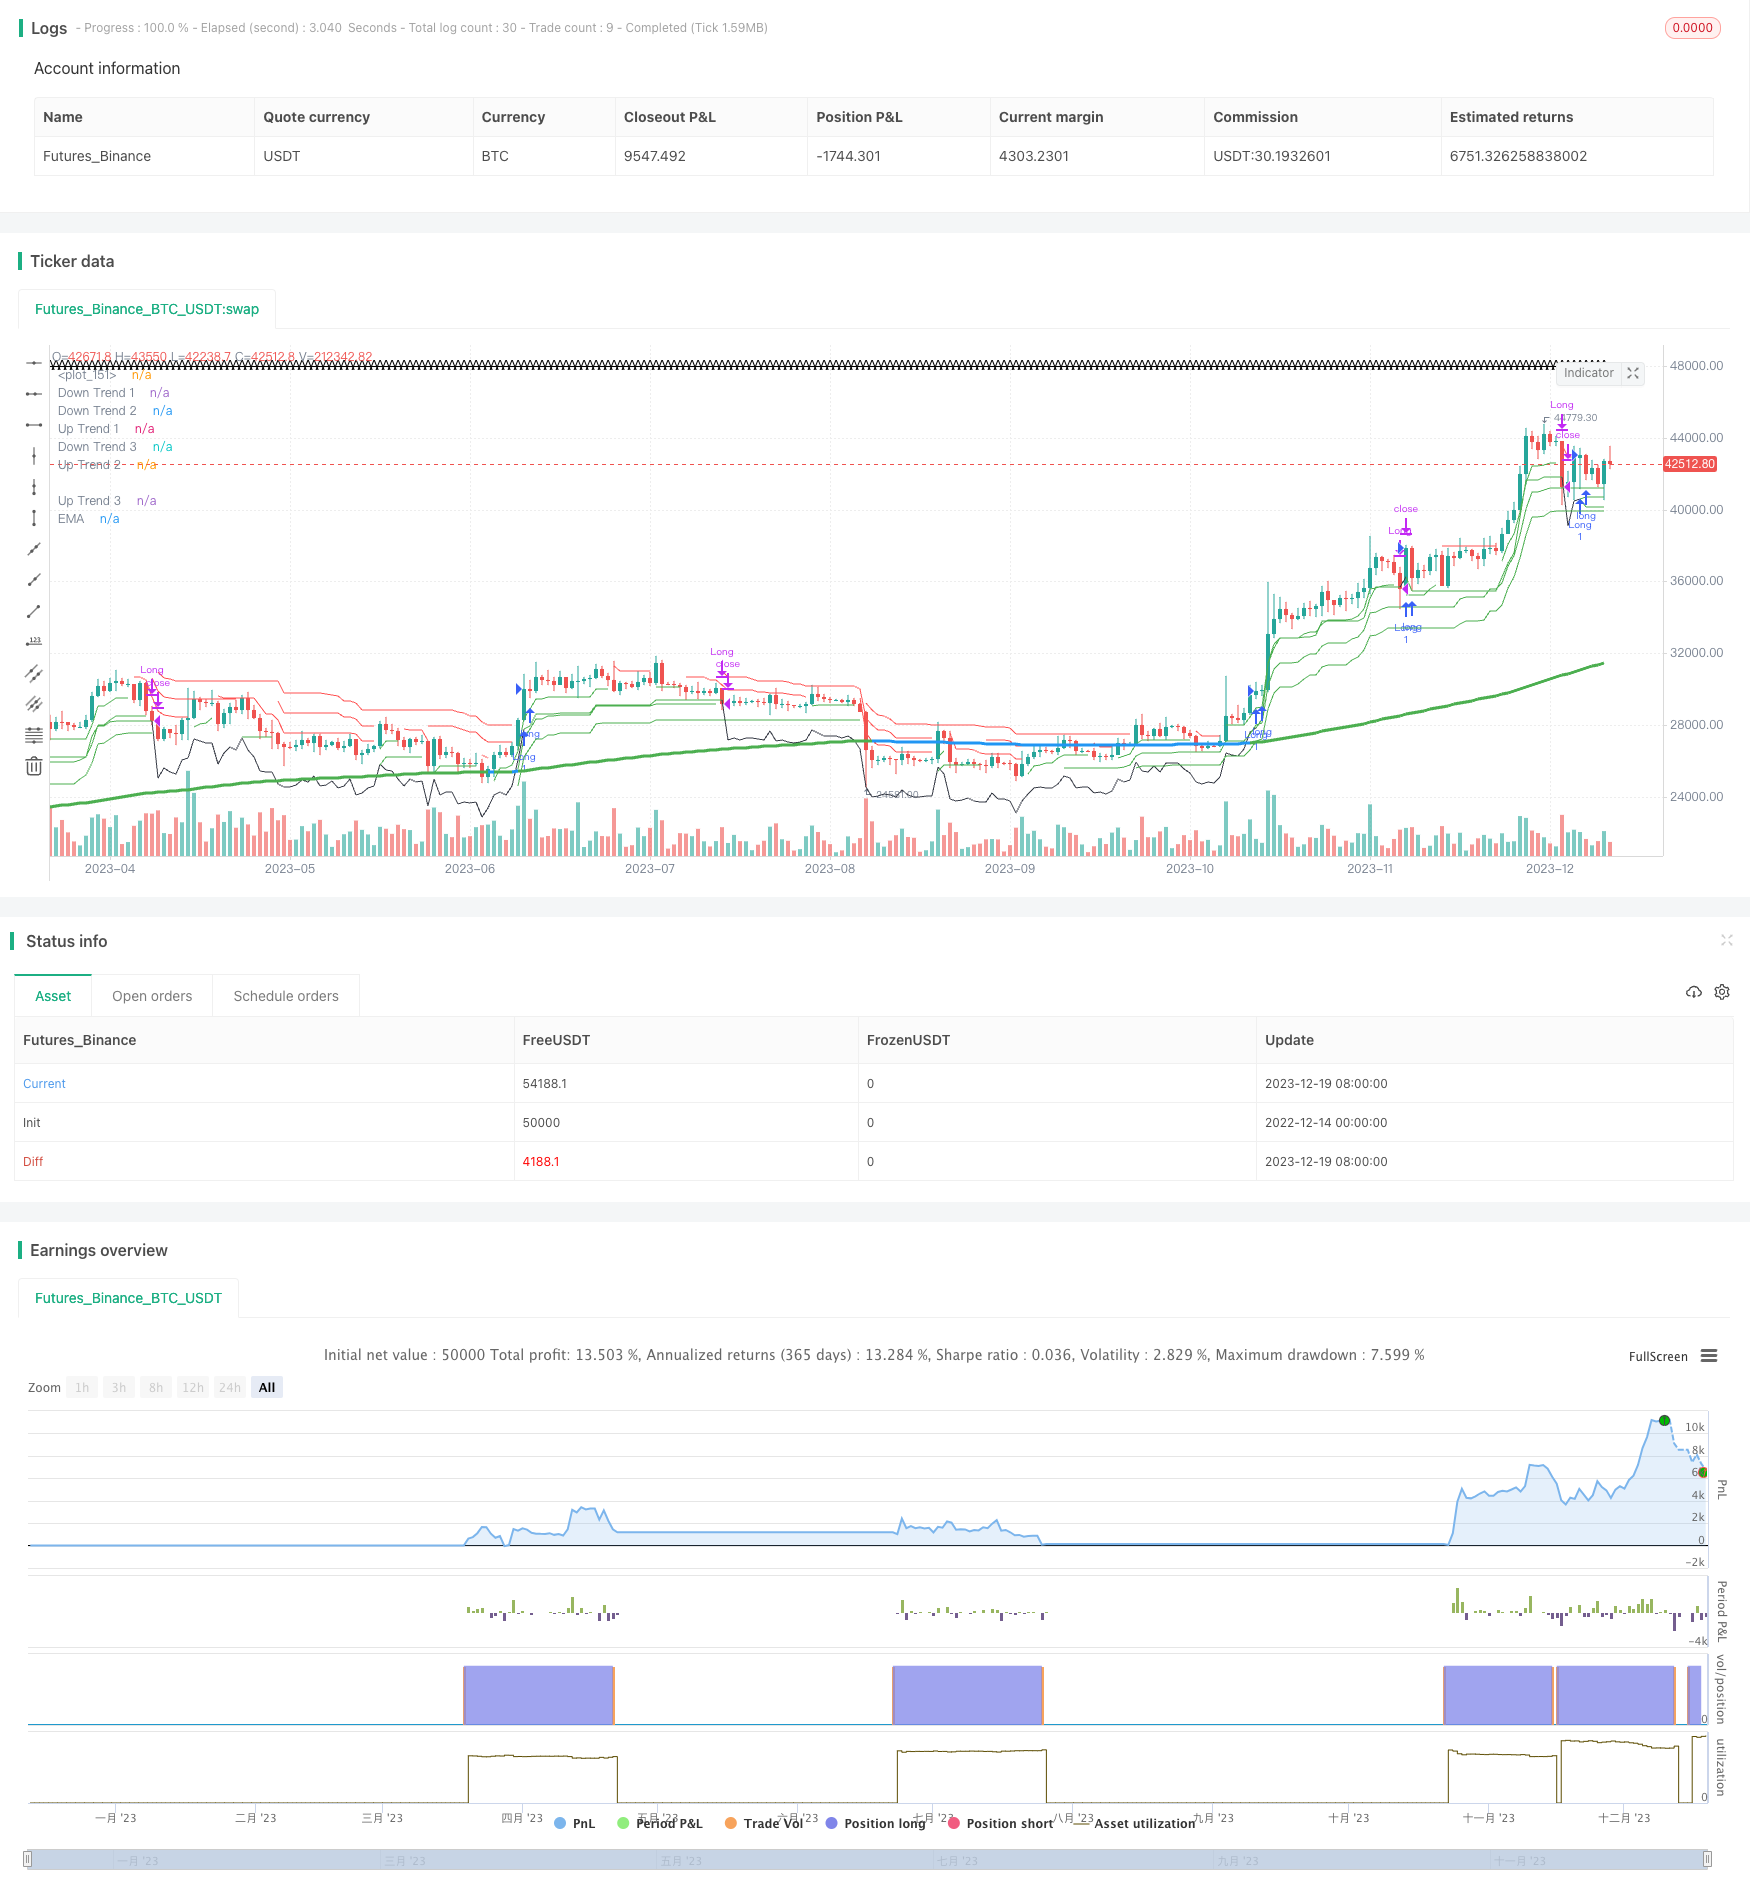
3つの超トレンド均線 supertrend1,supertrend2,supertrend3を設定し,緑色は上昇傾向を示し,赤色は下降傾向を示します.
EMAを平滑移動平均 ematrendに設定し,大トレンドを定義し,三つの超トレンド平均線がすべてこの EMAよりも高いとき,大盤多頭トレンドとして定義され,逆は空頭トレンドとして定義される。
大盤多頭の場合,少なくとも2つの超トレンド平均線が同時に多頭 ((緑色) を表示する場合は,方向値が0より小さい場合は多頭信号として判断する. 大盤空頭の場合,少なくとも2つの超トレンド平均線が同時に空頭 ((赤色) を表示する場合は,方向値が0より大きい場合は空頭信号として判断する.
信号が出た時に,オフ/オフのポジションを開きます.
ストップ・ストップ条件を設定する. 固定ストップをリスク・リターン比率,すなわち・損失比率3に設定し,移動ストップを下落のATRに設定する.
ストップ・ロースまたはストップ・ストップ条件が発動したときに平仓する.
優位分析
この戦略の利点は以下の通りです.
三重超トレンド平均線と組み合わせたトレンド判断EMAを使用し,トレンド信号を効果的に識別することができる.
多空条件判定の規則は明確で,容易に理解し,実行する.
モバイルストップと固定ストップを設定し,リスクを効果的に制御する.
超パラメータを必要に応じて調整し,戦略を最適化できます.
リスク分析
この戦略にはリスクもあります.
超パラメータの設定を間違えた場合,良い取引機会を逃す可能性があります.異なるATR周期,ATR倍数,EMA周期パラメータをテストすることができます.
突破失敗の確率は存在し,超パラメータを調整することで確率を下げることができる.
ストップ・ロッドまたはストップ・ストップを過度に緩やかに設定すると,損失の可能性が増加する. ストップ・ロッドの範囲を適切に絞り込む.
回測データには過適合の問題が生じやすい。多市場多周期テストに注意すべきである。
最適化の方向
この戦略は以下の点で最適化できます.
最適な超パラメータの組み合わせをテストする.異なるATR周期,ATR倍数,EMA平均周期を組み合わせてテストして,最適なパラメータを見つけることができる.
取引品種を増やす 戦略の有効性を検証するために,株式,デジタル通貨などの異なる品種を追加できます.
他の指標のフィルタリング信号と組み合わせます.例えば,RSI,MACDなどの指標を添加してトレンド信号の誤読を防ぐことができます.
損失停止の最適化. 損失の追跡をテストしたり,ATR/波動率の変化に基づく損失の停止方法をテストすることもできます.
要約する
三重超トレンド均線突破策は,全体的に比較してシンプルで実用的なトレンド追跡策である.複数の超トレンド均線とトレンド判断EMAを組み合わせて,チャンスを発見し,リスクを効果的に制御する.パラメータ最適化とルール最適化により,よりよい効果を得ることができる.この戦略は,理解しやすいし,学ぶに値する.
/*backtest
start: 2022-12-14 00:00:00
end: 2023-12-20 00:00:00
period: 1d
basePeriod: 1h
exchanges: [{"eid":"Futures_Binance","currency":"BTC_USDT"}]
*/

// @version=5
// author=theasgard and moonshot-indicator (ms)
// year 2021
//
// This is a well knowen strategy by using 3 different Supertrends and a trend-defining EMA,
// feel free to play around with the settings, a backtest on 8h ETHUSDT pair brought some good results using
// the 233EMA and investing 75% of a 10k start capital
//
// the idea is to have at least 2 supertrnds going green above the trend-EMA to go long and exit by turning
// 2 supertrends red (idea: 1 supertrend in red could initialize a take profit)
// shorts work vice versa
// The EMA shows in green for uptrends and in red for downtrends, if it is blue no Signal will be taken because
// the 3 supertrends are not all above or below the trendline(EMA)
//
// Update 1:
// Fixed a minor input error
// Added ATR stoploss, and commented out the percentage stop loss
// Added time window to backtest
// Added exit on risk/revard is met
// This version is only buy...wait for next update adding shorts

strategy("ms hypertrender", overlay=true)

// set up 3 supertrendlines and colour the direction up/down
atrPeriod1 = input(10, "ATR Length 1")
factor1 = input.float(1.0, "ATR Factor 1", step = 0.01)
[supertrend1, direction1] = ta.supertrend(factor1, atrPeriod1)
upTrend1 = plot(direction1 < 0 ? supertrend1 : na, "Up Trend 1", color = color.green, style=plot.style_linebr)
downTrend1 = plot(direction1 < 0? na : supertrend1, "Down Trend 1", color = color.red, style=plot.style_linebr)

atrPeriod2 = input(11, "ATR Length 2")
factor2 = input.float(2.0, "ATR Factor 2", step = 0.01)
[supertrend2, direction2] = ta.supertrend(factor2, atrPeriod2)
upTrend2 = plot(direction2 < 0 ? supertrend2 : na, "Up Trend 2", color = color.green, style=plot.style_linebr)
downTrend2 = plot(direction2 < 0? na : supertrend2, "Down Trend 2", color = color.red, style=plot.style_linebr)

atrPeriod3 = input(12, "ATR Length 3")
factor3 = input.float(3.0, "ATR Factor 3", step = 0.01)
[supertrend3, direction3] = ta.supertrend(factor3, atrPeriod3)
upTrend3 = plot(direction3 < 0 ? supertrend3 : na, "Up Trend 3", color = color.green, style=plot.style_linebr)
downTrend3 = plot(direction3 < 0? na : supertrend3, "Down Trend 3", color = color.red, style=plot.style_linebr)

//set up the trend dividing EMA and color uptrend nutreal downtrend
len = input.int(233, minval=1, title="Trend-EMA Length")
src = input(close, title="Source")
offset = input.int(title="Offset", defval=0, minval=-500, maxval=500)

//general Bull or Bear Trend? Visualized by ema
ematrend = ta.ema(src, len)
generaluptrend = supertrend1 > ematrend and supertrend2 > ematrend and supertrend3 > ematrend
generaldowntrend = supertrend1 < ematrend and supertrend2 < ematrend and supertrend3 < ematrend
emacolor = if generaluptrend
    color.green
else if generaldowntrend
    color.red
else
    color.blue
plot(ematrend, title="EMA", color=emacolor, linewidth=3, offset=offset)

// Bullish? min 2 supertrends green
bullish = (direction1 < 0 and direction2 < 0) or (direction1 < 0 and direction3 < 0) or (direction2 < 0 and direction3 < 0) and generaluptrend
extremebullish = direction1 < 0 and direction2 < 0 and direction3 < 0 and generaluptrend //all 3 green

// Bearish? min 2 supertrends red
bearish = (direction1 > 0 and direction2 > 0) or (direction1 > 0 and direction3 > 0) or (direction2 > 0 and direction3 > 0) and generaldowntrend
extremebearish = direction1 > 0 and direction2 > 0 and direction3 > 0 and generaldowntrend //all 3 red

// Open Long
//plotchar(((bullish and not bullish[1]) or (extremebullish and not extremebullish[1])) and (emacolor==color.green)? close : na, title = 'Start Long', char='▲', color = #80eb34, location = location.belowbar, size = size.small)

// TP 10% Long
TP10long = ((generaluptrend and bullish[1]) or (generaluptrend and extremebullish[1])) and (direction1 > 0 or direction2 > 0 or direction3 > 0)
//plotchar(TP10long and not TP10long[1]? close : na, title = 'TP on Long', char='┼', color = #ffd000, location = location.abovebar, size = size.tiny)

// Exit Long
//plotchar(extremebearish and not extremebearish[1] or bearish and not bearish[1]? close : na, title = 'Close all Longs', char='Ꭓ', color = #ff0037, location = location.abovebar, size = size.tiny)
stopsupertrendup = if supertrend1 < supertrend2 and supertrend1 < supertrend3
    (supertrend1)
else if supertrend2 < supertrend1 and supertrend2 < supertrend3
    (supertrend2)
else if supertrend3 < supertrend1 and supertrend3 < supertrend2
    (supertrend3)
lowestLows = ta.lowest(low, 1)
// Open Short
//plotchar(((bearish and not bearish[1]) or (extremebearish and not extremebearish[1])) and (emacolor==color.red)? close : na, title = 'Start Short', char='▼', color = #0547e3, location = location.abovebar, size = size.small)

// TP 10% Short
TP10short = ((generaldowntrend and bearish[1]) or (generaldowntrend and extremebearish[1])) and (direction1 < 0 or direction2 < 0 or direction3 < 0)
//plotchar(TP10short and not TP10short[1]? close : na, title = 'TP on Short', char='┼', color = #ffd000, location = location.belowbar, size = size.tiny)

// Exit Short
//plotchar(extremebullish and not extremebullish[1] or bullish and not bullish[1]? close : na, title = 'Close all Shorts', char='Ꭓ', color = #ff0037, location = location.belowbar, size = size.tiny)
stopsupertrenddown = if supertrend1 > supertrend2 and supertrend1 > supertrend3
    (supertrend1)
else if supertrend2 > supertrend1 and supertrend2 > supertrend3
    (supertrend2)
else if supertrend3 > supertrend1 and supertrend3 > supertrend2
    (supertrend3)
highestHighs = ta.highest(high,1)
// Set stop loss level with input options (optional)
//longLossPerc = input.float(title="Long Stop Loss (%)",
//     minval=0.0, step=0.1, defval=1) * 0.01

//shortLossPerc = input.float(title="Short Stop Loss (%)",
//     minval=0.0, step=0.1, defval=1) * 0.01

// Determine stop loss price
//longStopPrice  = strategy.position_avg_price * (1 - longLossPerc)
//shortStopPrice = strategy.position_avg_price * (1 + shortLossPerc)

openlong = (extremebullish and not extremebullish[1]) and (emacolor==color.green)//(((bullish and not bullish[1]) or
openshort = (extremebearish and not extremebearish[1]) and (emacolor==color.red)//(((bearish and not bearish[1]) or
exitlong = lowestLows<(stopsupertrendup - ((stopsupertrendup / 100) * 0.1)) //(extremebearish and not extremebearish[1] or bearish and not bearish[1]) or TP10long or
exitshort = highestHighs>(stopsupertrenddown - ((stopsupertrenddown / 100) * 0.1)) //(extremebullish and not extremebullish[1] or bullish and not bullish[1]) or TP10short
//strategy.entry("buy", strategy.long, when=openlong)
//strategy.entry("sell", strategy.short, when=openshort)

//strategy.close("buy", when=exitlong)
//strategy.close("sell", when=exitshort)

// Submit exit orders based on calculated stop loss price
//if (strategy.position_size > 0)
//    strategy.exit(id="Long Stop", stop=longStopPrice)

//if (strategy.position_size < 0)
//    strategy.exit(id="Short Stop", stop=shortStopPrice)

backtest_timeframe_start = input(defval = timestamp("01 Apr 2016 13:30 +0000"), title = "Backtest Start Time")
USE_ENDTIME = input(false,title="Define the ending period for backtests (If false, will test up to most recent candle)")
backtest_timeframe_end = input(defval = timestamp("19 Mar 2021 19:30 +0000"), title = "Backtest End Time")
TARGET_PROFIT_MODE = input(false,title="Exit when Risk:Reward met")
REWARD_RATIO = input(3,title="Risk:[Reward] (i.e. 3) for exit")
// Trailing stop loss {
TSL_ON = input(true,title="Use trailing stop loss")
var entry_price = float(0)
ATR_multi_len = 26
ATR_multi = input(2, "ATR multiplier for stop loss")
ATR_buffer = ta.atr(ATR_multi_len) * ATR_multi
plotchar(ATR_buffer, "ATR Buffer", "A", location = location.top)
risk_reward_buffer = (ta.atr(ATR_multi_len) * ATR_multi) * REWARD_RATIO
take_profit_long = low > entry_price + risk_reward_buffer
take_profit_short = low < entry_price - risk_reward_buffer
var trailing_SL_buffer = float(0)
var stop_loss_price = float(0)
stop_loss_price := math.max(stop_loss_price, close - trailing_SL_buffer)
// plot TSL line
trail_profit_line_color = color.green
if strategy.position_size == 0  or not TSL_ON
    trail_profit_line_color := color.black
    stop_loss_price := close - trailing_SL_buffer
plot(stop_loss_price,color=trail_profit_line_color)
// }

if true
    buy_condition = openlong
    exit_condition = exitlong
    //ENTRY:
    if buy_condition
        if strategy.position_size == 0
            entry_price := close
            trailing_SL_buffer := ATR_buffer
            stop_loss_price := close - ATR_buffer

        msg = "entry"
        if strategy.position_size > 0
            msg := "pyramiding"
        strategy.entry("Long",strategy.long, comment=msg)

    //EXIT:
    // Case (A) hits trailing stop
    if TSL_ON and strategy.position_size > 0 and close <= stop_loss_price
        if close > entry_price
            strategy.close("Long", comment="take profit [trailing]")
        else if close <= entry_price
            strategy.close("Long", comment="stop loss")
    // Case (B) take targeted profit relative to risk
    if strategy.position_size > 0 and TARGET_PROFIT_MODE
        if take_profit_long
            strategy.close("Long", comment="take profits [risk:reward]")
    // Case (C)
    if strategy.position_size > 0 and exit_condition
        if take_profit_long
            strategy.close("Long", comment="exit[rsi]")