ボラティリティ指標とストキャスティクス指標に基づくマルチタイムフレーム取引戦略
作成日:
2023-12-21 14:34:42
最終変更日:
2023-12-21 14:34:42
コピー:
0
クリック数:
805
1
フォロー
1751
フォロワー
概要
この戦略は,波動性指標VIXとランダム指標RSIを融合し,異なる時間周期指標の組み合わせにより,高効率の突破買いと超買い超売りのストップ・ローズ・ペイポジションを実現します.戦略の最適化スペースは大きく,異なる市場環境に対応できます.
戦略原則
VIX変動率指数を計算する:過去20日間の最高値と最低値の変動率を計算する. 変動率が上線より高いときは,市場パニックを示し,下線より低い場合は,市場Complacencyを示します.
RSIのランダムな指標を計算します. 過去14日の上昇と低下を計算します. RSIが70を超えるときは超買い領域で,30を下回ると超売り領域です.
2つの指標を融合させ,波動率が上線または最高パーセントよりも高いときに多めに行います. RSIが70以上であるときに平仓します.
戦略的優位性
- 複数の指標を融合させ,市場のタイミングを総合的に判断する.
- 異なる時間周期の指標が相互検証され,意思決定の正確性が向上する.
- 異なる取引品種に合わせて最適化できる調整パラメータ.
リスク分析
- パラメータを正しく設定しない場合,複数の偽信号が発生する可能性があります.
- 単一の平仓指数は,価格の逆転を逃すことができます.
改善の提案
- 平均線,ブリン帯などの検証指標を追加する.
- K線形を反転させるなど,平仓指数を増やす.
要約する
この戦略は,VIX指数を使用して市場のタイミングとリスクレベルを判断し,RSI指数と連携して,過剰買い過剰売りをフィルターする不利な取引ポイントをフィルターし,効率的なタイミングで購入し,適切なタイミングで損失を止めます.戦略の最適化スペースは大きく,より広範な市場環境に適応できます.
ストラテジーソースコード
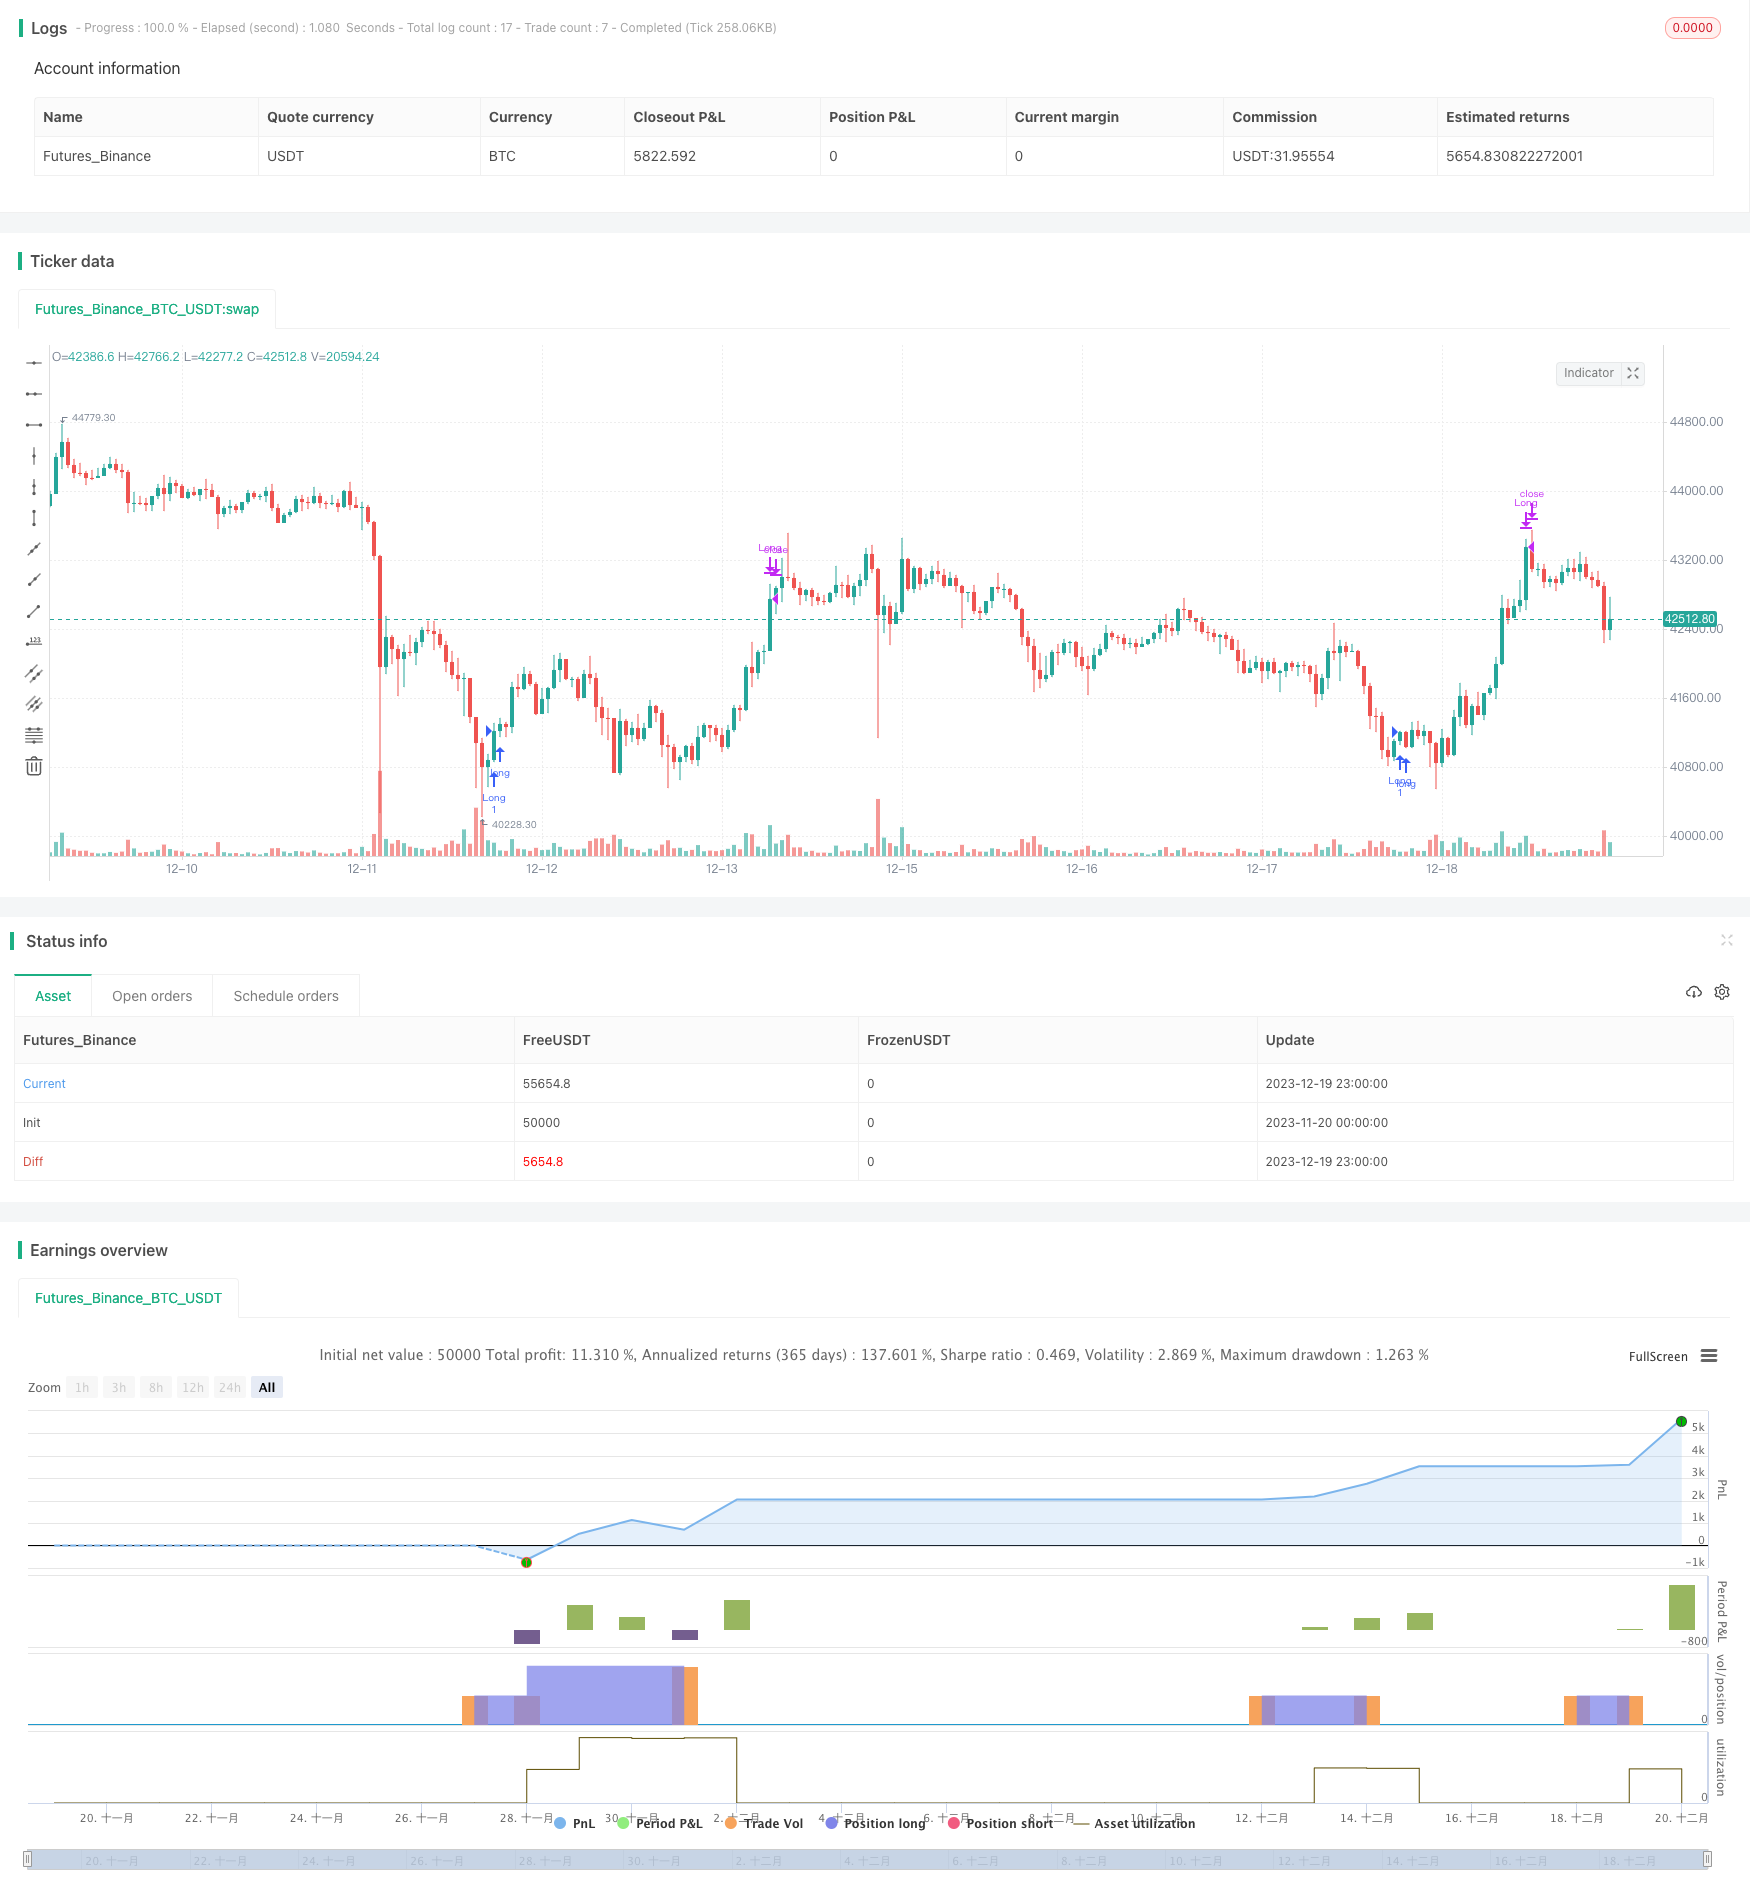
/*backtest
start: 2023-11-20 00:00:00
end: 2023-12-20 00:00:00
period: 1h
basePeriod: 15m
exchanges: [{"eid":"Futures_Binance","currency":"BTC_USDT"}]
*/

//@version=5
// This source code is subject to the terms of the Mozilla Public License 2.0 at https://mozilla.org/MPL/2.0/
// © timj

strategy('Vix FIX / StochRSI Strategy', overlay=true, pyramiding=9, margin_long=100, margin_short=100)

Stochlength = input.int(14, minval=1, title="lookback length of Stochastic")
StochOverBought = input.int(80, title="Stochastic overbought condition")
StochOverSold = input.int(20, title="Stochastic oversold condition")
smoothK = input(3, title="smoothing of Stochastic %K ")
smoothD = input(3, title="moving average of Stochastic %K")
k = ta.sma(ta.stoch(close, high, low, Stochlength), smoothK)
d = ta.sma(k, smoothD)

///////////// RSI
RSIlength = input.int( 14, minval=1 , title="lookback length of RSI")
RSIOverBought = input.int( 70  , title="RSI overbought condition")
RSIOverSold = input.int( 30  , title="RSI oversold condition")
RSIprice = close
vrsi = ta.rsi(RSIprice, RSIlength)

///////////// Double strategy: RSI strategy + Stochastic strategy

pd = input(22, title="LookBack Period Standard Deviation High")
bbl = input(20, title="Bolinger Band Length")
mult = input.float(2.0    , minval=1, maxval=5, title="Bollinger Band Standard Devaition Up")
lb = input(50  , title="Look Back Period Percentile High")
ph = input(.85, title="Highest Percentile - 0.90=90%, 0.95=95%, 0.99=99%")
new = input(false, title="-------Text Plots Below Use Original Criteria-------" )
sbc = input(false, title="Show Text Plot if WVF WAS True and IS Now False")
sbcc = input(false, title="Show Text Plot if WVF IS True")
new2 = input(false, title="-------Text Plots Below Use FILTERED Criteria-------" )
sbcFilt = input(true, title="Show Text Plot For Filtered Entry")
sbcAggr = input(true, title="Show Text Plot For AGGRESSIVE Filtered Entry")
ltLB = input.float(40, minval=25, maxval=99, title="Long-Term Look Back Current Bar Has To Close Below This Value OR Medium Term--Default=40")
mtLB = input.float(14, minval=10, maxval=20, title="Medium-Term Look Back Current Bar Has To Close Below This Value OR Long Term--Default=14")
str = input.int(3, minval=1, maxval=9, title="Entry Price Action Strength--Close > X Bars Back---Default=3")
//Alerts Instructions and Options Below...Inputs Tab
new4 = input(false, title="-------------------------Turn On/Off ALERTS Below---------------------" )
new5 = input(false, title="----To Activate Alerts You HAVE To Check The Boxes Below For Any Alert Criteria You Want----")
sa1 = input(false, title="Show Alert WVF = True?")
sa2 = input(false, title="Show Alert WVF Was True Now False?")
sa3 = input(false, title="Show Alert WVF Filtered?")
sa4 = input(false, title="Show Alert WVF AGGRESSIVE Filter?")

//Williams Vix Fix Formula
wvf = ((ta.highest(close, pd)-low)/(ta.highest(close, pd)))*100
sDev = mult * ta.stdev(wvf, bbl)
midLine = ta.sma(wvf, bbl)
lowerBand = midLine - sDev
upperBand = midLine + sDev
rangeHigh = (ta.highest(wvf, lb)) * ph

//Filtered Bar Criteria
upRange = low > low[1] and close > high[1]
upRange_Aggr = close > close[1] and close > open[1]
//Filtered Criteria
filtered = ((wvf[1] >= upperBand[1] or wvf[1] >= rangeHigh[1]) and (wvf < upperBand and wvf < rangeHigh))
filtered_Aggr = (wvf[1] >= upperBand[1] or wvf[1] >= rangeHigh[1]) and not (wvf < upperBand and wvf < rangeHigh)

//Alerts Criteria
alert1 = wvf >= upperBand or wvf >= rangeHigh ? 1 : 0
alert2 = (wvf[1] >= upperBand[1] or wvf[1] >= rangeHigh[1]) and (wvf < upperBand and wvf < rangeHigh) ? 1 : 0
alert3 = upRange and close > close[str] and (close < close[ltLB] or close < close[mtLB]) and filtered ? 1 : 0
alert4 = upRange_Aggr and close > close[str] and (close < close[ltLB] or close < close[mtLB]) and filtered_Aggr ? 1 : 0

//Coloring Criteria of Williams Vix Fix
col = wvf >= upperBand or wvf >= rangeHigh ? color.lime : color.gray

isOverBought = (ta.crossover(k,d) and k > StochOverBought) ? 1 : 0
isOverBoughtv2 = k > StochOverBought ? 1 : 0
filteredAlert = alert3 ? 1 : 0
aggressiveAlert = alert4 ? 1 : 0


if (filteredAlert or aggressiveAlert)
    strategy.entry("Long", strategy.long)

if (isOverBought)
    strategy.close("Long")