JBravo定量トレンド戦略
戦略概要
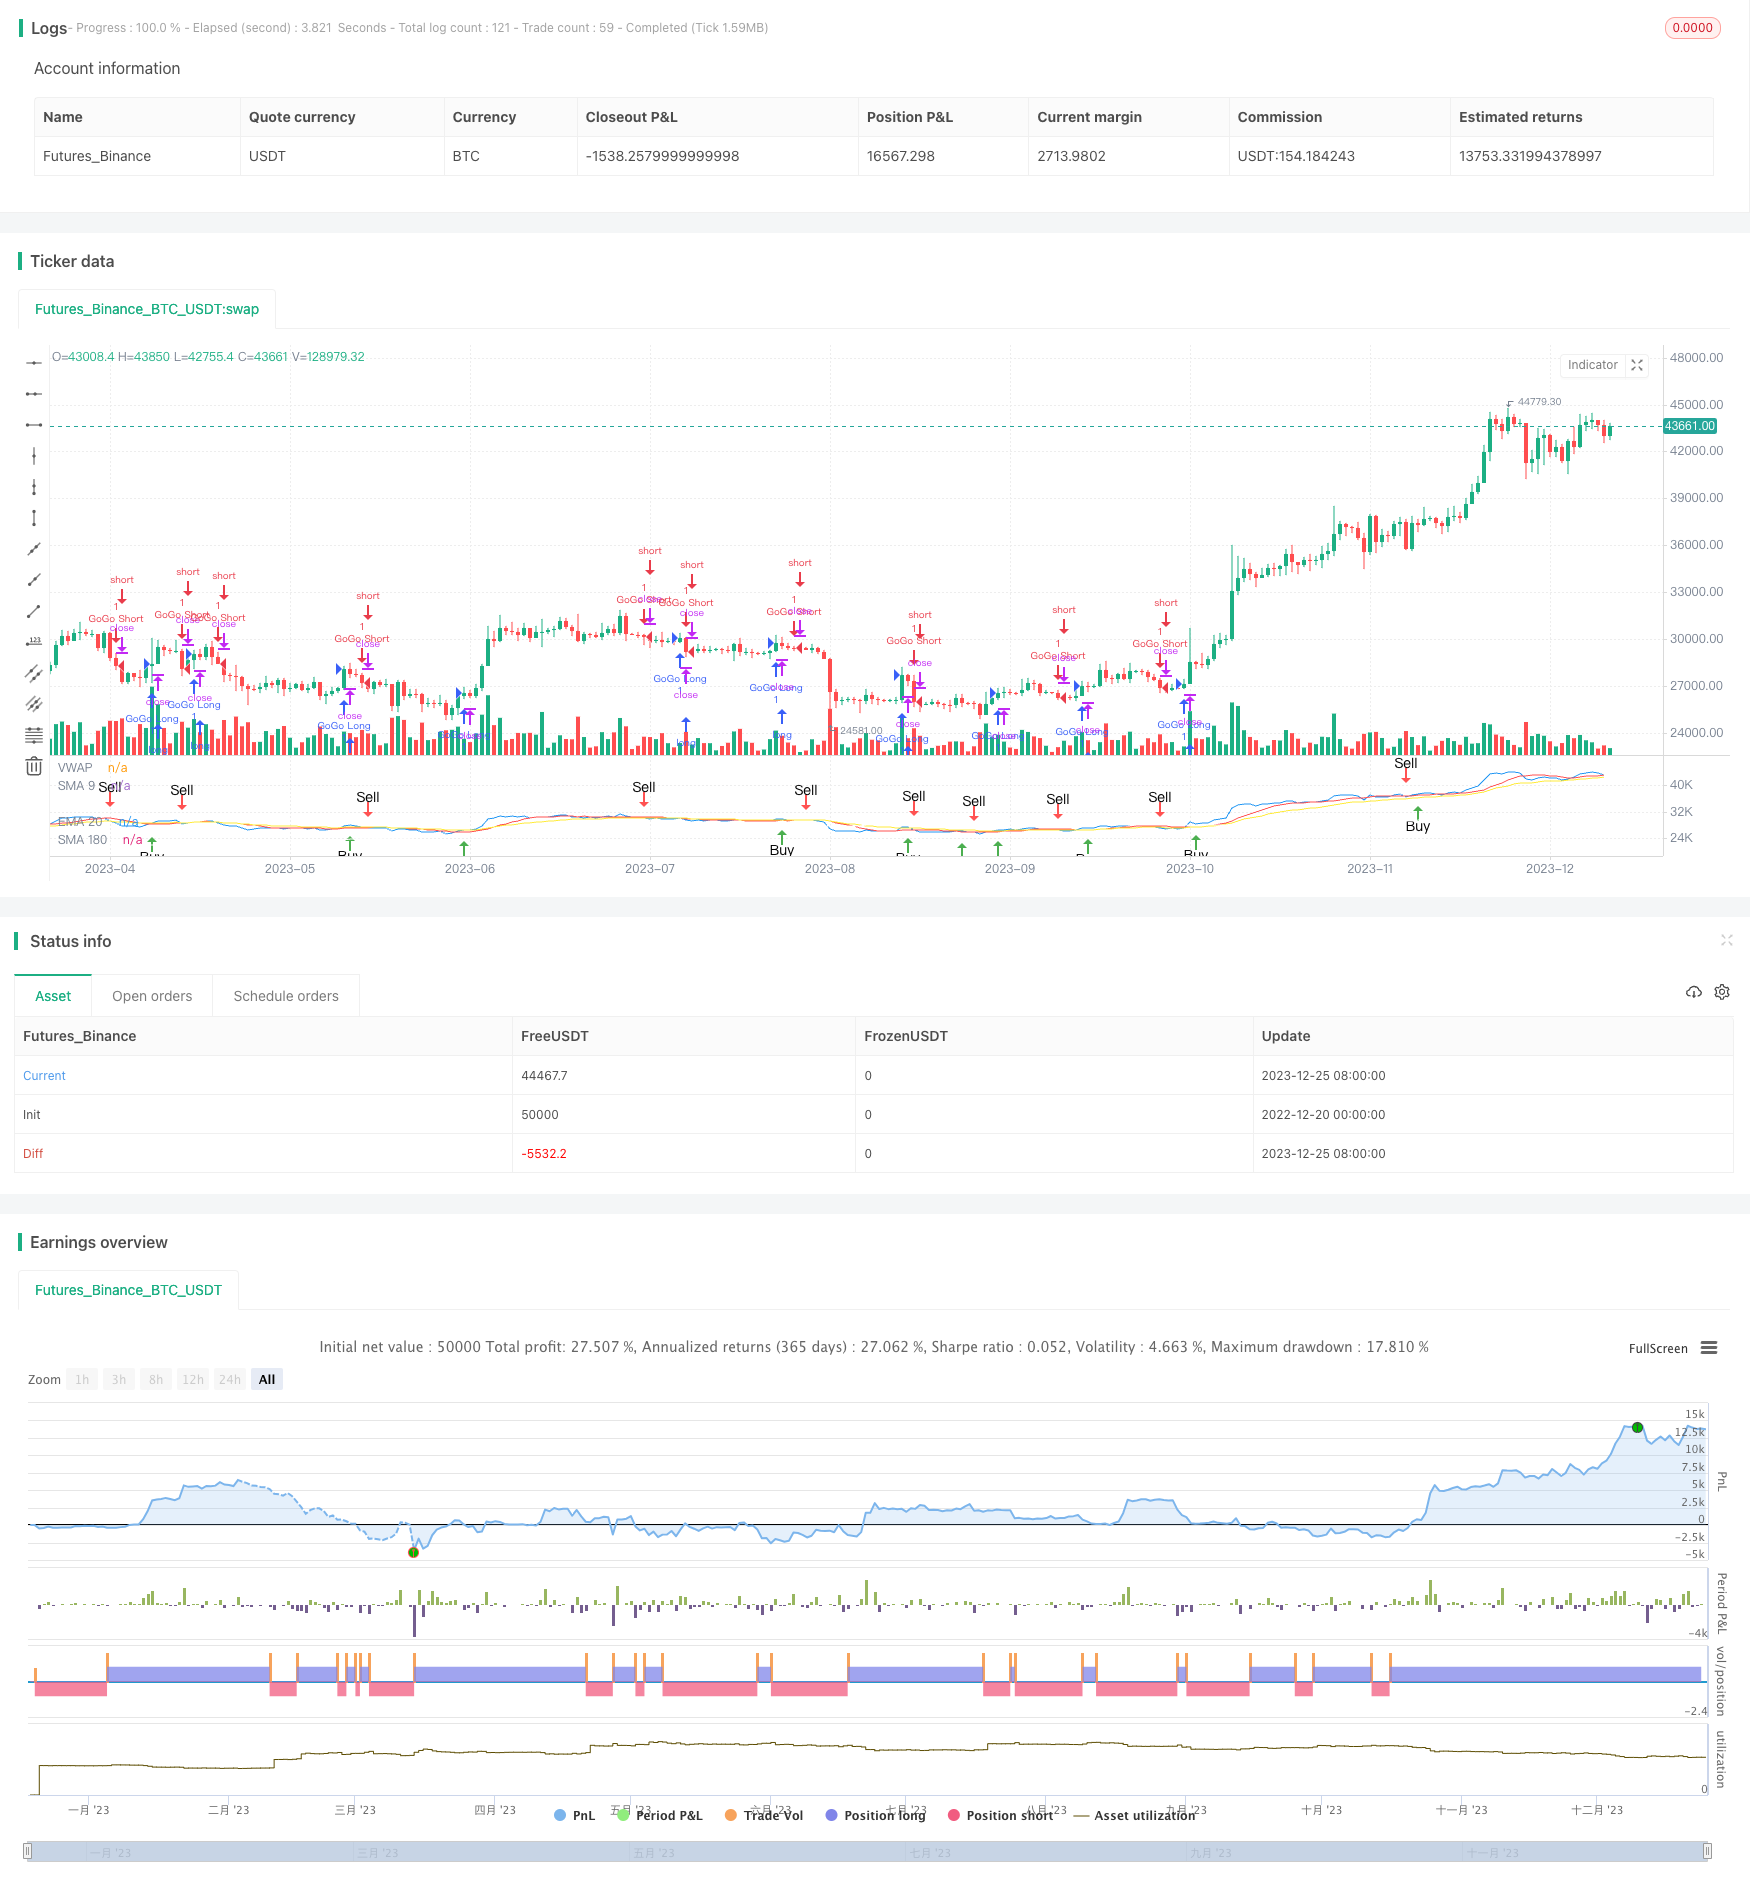
JBravoの量化トレンド戦略は,移動平均に基づいたトレンド追跡戦略である.それは,9日間のシンプル移動平均,20日間の指数移動平均と180日間のシンプル移動平均を使用して,市場のトレンド方向と最終的な買入と売却の信号を判断する.
この戦略の名称は,自信と決定的な取引の決定を象徴するジョニー・ブラボーというアニメのキャラクターからインスピレーションを得ています. GoGoの果汁のという用語は,VWAP線が20日指数移動平均を横切ったときに激進的に入場することを描写しています.
戦略原則
K線の閉盘価格の上部で9日単数移動平均を穿越すると,買入シグナルが生じ,閉盘価格下部で20日指数移動平均を穿越すると,売り出せシグナルが生じます.
9日,20日,180日移動平均がすべて上方であり,9日移動平均が20日移動平均より高く,20日移動平均が180日移動平均より高い場合,強烈な買い信号が生じます.
9日,20日,180日移動平均がすべて下向きで,9日移動平均が20日移動平均より低く,20日移動平均が180日移動平均より低い場合,強いセールシグナルが生じます.
交差量加重平均価格線が20日指数移動平均線を上から下を通るときは,GoGo看信号を生じます.交差量加重平均価格線が20日指数移動平均線を上から下を通るときは,GoGo看信号を生じます.
戦略的優位分析
この戦略は,トレンド追跡と突破の戦略思想を組み合わせている.移動平均は,市場のトレンド方向を明確に判断し,誤った取引の確率を減らす.同時に,取引量重み平均価格という指標を,入場タイミングを判断するために柔軟に使用し,市場突破を期待しながらリスクを制御している.
この戦略は,移動平均のみを使用するよりも,強気な状況でより高い市場報酬率を得ることができるGoGo果汁の激進エントリーメカニズムを追加した.
この戦略は,全体的に見ると,小規模で,安定した収益性を有している.
戦略的リスク分析
この戦略は強力な入場メカニズムを追加したにもかかわらず,ストップ・ロースは揺動的な状況で頻繁にトリガーされる可能性があります.さらに,移動平均自体は遅滞性があり,価格の変化を間に合うように捉えることはできません.
これは,戦略が市場価格を反映しない仮想取引を一定量に発生させる可能性があることを意味します. さらに,強引な入場は損失のリスクを高めます.
リスクを軽減するために,移動平均の周期を適切に調整することができます.または,損失が一定の幅に達した後に損失を停止して退出するストップモジュールを追加できます.
戦略最適化の方向性
この戦略は以下の方向で最適化できます.
移動平均のパラメータを調整し,周期パラメータを最適化し,最適なパラメータの組み合わせを見つける
取引量指標の判断を高め,価格の急激な変動で誤った信号を避ける
ストップ・モジュールを追加し,オフルールを設定し,単発損失を制御する
市場におけるホットセクターの選択と連携して,戦略をよりターゲットにする
ポジション開設比率の最適化,異なるパラメータのポジションスケールの最適化
要約する
JBravoの定量トレンド戦略は,移動平均分析と取引量重み平均価格のトレンド判断を統合している.それは,安定した長線利益を追求し,同時に,ある種の積極的な取引機構を持っている.この戦略は,中長線保有,リスク中等偏好,高い収益率に適している.それは,ポートフォリオ取引戦略の構成要素となり,市場適応性が良好である.
||
Strategy Overview
The JBravo Quantitative Trend Strategy is a trend-following strategy based on moving averages. It uses the 9-day simple moving average, 20-day exponential moving average, and 180-day simple moving average to determine the market trend direction, as well as the final buy and sell signals.
The strategy name is inspired by the cartoon character Johnny Bravo, representing a confident and decisive trading decision. The term “GoGo Juice” depicts the aggressive entry when the VWAP line crosses the 20-day exponential moving average.
Strategy Principle
A buy signal is generated when the closing price crosses above the 9-day simple moving average; A sell signal is generated when the closing price crosses below the 20-day exponential moving average.
If the 9-day, 20-day and 180-day moving averages are all moving up, and the 9-day moving average is above the 20-day moving average, the 20-day moving average is above the 180-day moving average, a strong buy signal is generated.
If the 9-day, 20-day and 180-day moving averages are all moving down, and the 9-day moving average is below the 20-day moving average, the 20-day moving average is below the 180-day moving average, a strong sell signal is generated.
When the Volume Weighted Average Price line crosses the 20-day exponential moving average upward, a “GoGo Long” signal is generated; When the Volume Weighted Average Price line crosses the 20-day exponential moving average downward, a “GoGo Short” signal is generated.
Advantage Analysis
This strategy combines the ideas of trend following and breakout strategies. Moving averages can clearly determine the direction of the market trend and reduce the probability of wrong trades. At the same time, it flexibly uses the VWAP indicator to determine the entry time, controlling risks while favoring breakthroughs in the market.
Compared to using moving averages alone, this strategy adds the aggressive entry mechanism of “GoGo Juice”, which can obtain higher returns in strong trends.
Overall, this strategy has small drawdowns and stable profitability.
Risk Analysis
Although the strategy increases the strength of entries, stop loss points can be frequently triggered in sideways markets. In addition, moving averages themselves have high inertia and cannot keep up with price changes in time.
This means that the strategy may generate a certain number of virtual trades that do not actually reflect market price movements. In addition, aggressive entries also increase the risk of losses.
To reduce risks, we can adjust the cycle of moving averages as appropriate; or add a stop loss module to stop loss when losses reach a certain level.
Optimization Directions
The strategy can be optimized in the following directions:
Adjust moving average parameters and optimize cycle parameters to find the optimal parameter combination
Add volume indicators to avoid false signals in times of violent price fluctuations
Increase stop loss modules and set exit rules to control per trade loss
Combine selections of market hot sectors to make strategies more targeted
Optimize opening position proportions, optimize different scale for different parameters
Conclusion
The JBravo Quantitative Trend Strategy integrates moving average analysis and VWAP trend judgment. It pursues stable long-term profits while having a certain degree of aggressive trading mechanisms. The strategy is suitable for medium-long term holdings, with medium-high risks and high returns. It can become a part of portfolio trading strategies with very good market adaptability.
[/trans]
/*backtest
start: 2022-12-20 00:00:00
end: 2023-12-26 00:00:00
period: 1d
basePeriod: 1h
exchanges: [{"eid":"Futures_Binance","currency":"BTC_USDT"}]
*/

// This source code is subject to the terms of the Mozilla Public License 2.0 at https://mozilla.org/MPL/2.0/
// © bradvaughn

//@version=4
strategy("JBravo Swing", overlay = false)

var buy_in_progress = false


//Moving Averages
smaInput1 = input(title="Display SMA 9", type=input.bool, defval=true)
smaInput2 = input(title="Display EMA 20", type=input.bool, defval=true)
smaInput4 = input(title="Display SMA 180", type=input.bool, defval=true)
colored_180 = input(false, title="Color-code 180 trend direction")
vwapInput = input(title="Display VWAP", type=input.bool, defval=true)

sma9 = sma(close, 9)
ema20 = ema(close, 20)
sma180 = sma(close, 180)

//Plot Moving Averages
plot(smaInput1 ? sma9 : na, color= color.red, title="SMA 9")
plot(smaInput2 ? ema20 : na, color = color.yellow, title="EMA 20")

// Plot VWAP
vwap1 = vwap(hlc3)
plot(vwapInput ? vwap1 : na, color = color.blue, title="VWAP")
vwaplong = vwap1 > ema20
vwapshort = vwap1 < ema20

//Color SMA 180 trend direction if selected
sma180_uptrend = sma(close, 180) > sma(close[2], 180)
colr = sma180_uptrend == true or colored_180 == false ? color.white : colored_180 == true ? color.gray : na
plot(smaInput4 ? sma180 : na, color = colr, title="SMA 180")

//Get value of lower end of candle
buyLow = iff(lowest(open, 1) < lowest(close, 1), lowest(open, 1), lowest(close, 1))
sellLow = lowest(close, 1)

// Find the lower MA for crossover sell condition
sellma = iff((sma9<ema20), sma9, ema20)


//SMA 9 trend direction
sma9_uptrend = sma(close, 9) > sma(close[2], 9)
//EMA 20 trend direction
ema20_uptrend = ema(close, 20) > sma(close[2], 20)

//Buy or sell if conditions are met
// Buy when the candle low is above the SMA9
// Sell when the candle low is below the lower of SMA9 and EMA20
Buy = iff(buy_in_progress == false and buyLow > sma9 == true, true, false)
Sell = iff(buy_in_progress == true and sellLow < sellma == true, true, false)

// Determine stong buy and strong sell conditions.
// If moving averages are all up, then this will qualify a buy as a strong buy.
// If the moving averages are not up (ie. down) then this will qualify a sell as a strong sell
StrongBuy = iff (Buy and sma9_uptrend and sma180_uptrend and ema20_uptrend and (sma9 > ema20) and (ema20 > sma180), true, false)
StrongSell = iff (Sell and not sma9_uptrend and not sma180_uptrend and not ema20_uptrend and (sma9 < ema20) and (ema20 < sma180), true, false)

//Update Trading status if bought or sold
if Buy
    buy_in_progress := true
if Sell
    buy_in_progress := false

// Clear Buy and Sell conditions if StrongBuy or StrongSell conditions exist.
// This disables plotting Buy and Sell conditions
if StrongBuy
    Buy := false
if StrongSell
    Sell := false


//Display BUY/SELL indicators

plotshape(Buy,title="Buy", color=color.green, style=shape.arrowup,location=location.belowbar, text="Buy")
plotshape(StrongBuy,title="Strong Buy", color=color.green, style=shape.arrowup,location=location.belowbar, text="Strong Buy")
plotshape(Sell,title="Sell", color=color.red, style=shape.arrowdown,text="Sell")
plotshape(StrongSell,title="Strong Sell", color=color.red, style=shape.arrowdown,text="Strong Sell")

strategy.entry("GoGo Long", strategy.long, 1, when=vwaplong and vwapInput)
strategy.entry("GoGo Short", strategy.short, 1, when=vwapshort and vwapInput)

strategy.close("GoGo Long", when = vwapshort and vwapInput)
strategy.close("GoGo Short", when = vwaplong and vwapInput)


alertcondition(Buy, title="Buy Signal", message="Buy")
alertcondition(Sell, title="Sell Signal", message="Sell")