BankNiftyスーパートレンド取引戦略

概要
これはBankNiftyの5分足におけるスーパートレンドインジケーターを用いた取引戦略です。本戦略は主にスーパートレンドインジケーターでトレンドを識別し、取引時間帯やリスク管理ルールと組み合わせて取引を行います。
戦略の原理
本戦略ではまず、取引時間帯や日付範囲などの入力変数を定義します。取引時間帯はインドの取引時間である午前9時15分から午後3時10分に設定されています。
次に、スーパートレンドインジケーターとその方向を計算します。スーパートレンドインジケーターはトレンドの方向を識別できます。
各取引時間帯の開始時点で、戦略は3本のローソク足が形成されるのを待ってからエントリーを検討します。これは偽のブレイクアウトをフィルタリングするためです。
ロングシグナルはスーパートレンドインジケーターの方向が下から上に変わったとき、ショートシグナルは方向が上から下に変わったときです。
エントリー後はストップロスを設定します。固定ストップロス幅とトレーリングストップの割合は入力変数で調整可能です。
取引時間帯の終了時には、すべての未決済ポジションをクローズします。
戦略の優位性
本戦略はインジケーターを使用してトレンドを識別するシンプルな取引戦略です。以下のような優位性があります。
- スーパートレンドインジケーターでトレンド方向を判断することで、トレンドを効果的に識別できる
- 取引時間帯を考慮することで、最も値動きが激しい寄付きと引けの時間帯を回避できる
- トレーリングストップを設定することで、利益を確定できる
- 入力変数で自由に調整可能なパラメーターが多く、適応性が高い
戦略のリスク
本戦略には以下のようなリスクも存在します。
- スーパートレンドインジケーターには遅延が生じるため、最適なエントリータイミングを逃す可能性がある
- 単一のインジケーターによる判断は偽のブレイクアウトの影響を受けやすく、勝率が低くなる可能性がある
- 大局的なトレンドを考慮していないため、市場全体と逆行する可能性がある
- ストップロス幅の設定が適切でない場合、予想以上の損失が発生する可能性がある
これらのリスクは、スーパートレンドインジケーターのパラメーターを最適化したり、他のインジケーターを追加して判断したりすることで低減できます。
戦略の最適化の方向性
本戦略は以下の点からさらに最適化が可能です。
- 他のインジケーターを追加して組み合わせ戦略とすることで、戦略の安定性を高められる
- 市場全体の動向に対する判断を追加し、市場と逆行するのを防ぐ
- スーパートレンドインジケーターのパラメーターを最適化し、最適な期間と倍率を見つける
- ストップロス戦略を調整する(例:トレンドの進行に合わせてストップロスを徐々に調整する)
- 異なる取引銘柄でテストし、本戦略に最も適した銘柄を探す
まとめ
本戦略はBankNiftyの5分足を用いたスーパートレンドインジケーター取引戦略です。スーパートレンドインジケーターでトレンド方向を判断し、取引時間帯とリスク管理ルールを組み合わせて取引を行います。複雑な定量戦略と比較して、本戦略のルールはシンプルで明確であり、理解や実装が容易です。サンプル戦略として、今後の最適化や改善のための基盤と方向性を提供します。継続的な改良と向上により、本戦略が信頼性が高く安定した収益を生み出す定量取引戦略となることを期待します。
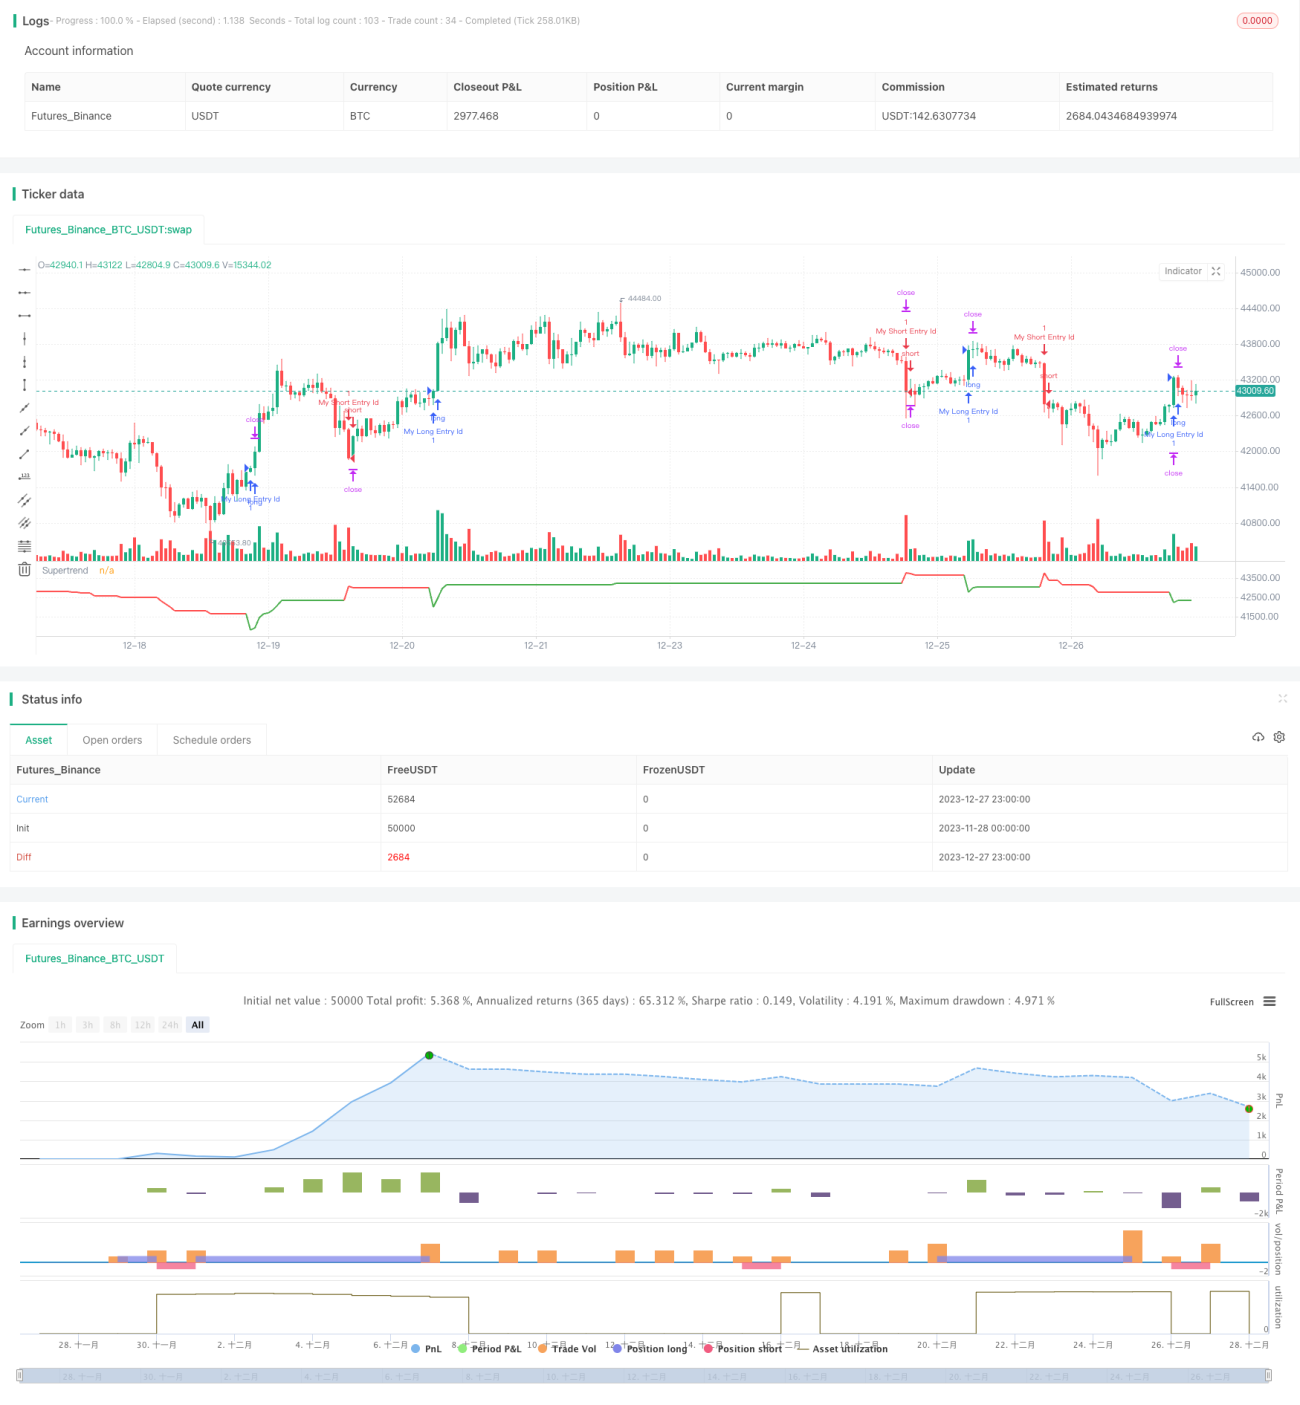
/*backtest
start: 2023-11-28 00:00:00
end: 2023-12-28 00:00:00
period: 1h
basePeriod: 15m
exchanges: [{"eid":"Futures_Binance","currency":"BTC_USDT"}]
*/

//@version=5
strategy("BankNifty 5min Supertrend Based Strategy, 09:15 Entry with Date Range and Risk Management")

// Session and date range input variables- 1