ボーアバンドATRトレーリングストップロス戦略
概要
この戦略は,ボール帯の指数と平均リアル波幅 (ATR) の指数を組み合わせて,フォローストップ機能を持つ突破取引戦略を形成する.価格が指定された標準差のボール帯を横断して上線または下線するとき,取引信号を発信する.同時に,ATR指数を使用してストップ・ロスの位置とストップ・ポジションを計算し,損益率制御を実現する.さらに,戦略には時間フィルタリングとパラメータ最適化などの機能があります.
戦略原則
第1段階では,中軌道線,上軌道線,下軌道線を計算します. 中軌道線は価格のSMAであり,上軌道線は価格の標準差の整数倍です. 価格が下軌道線から上方突破すると,多めにします. 上軌道線から下方突破すると,空っぽにします.
2つ目のステップは,ATR指標の計算である.ATR指標は,価格の平均波動幅を反映している.ATR値に基づいて長ポジションのストップ・ロス・ポイントと短ポジションのストップ・ロス・ポイントを設定している.同時に,ATR値に基づいてストップ・ストップ・ポジションを設定し,損益比率制御を実現している.
3つ目は,タイムフィルターを使って,重要なニュースイベントの激しい波動を避けるために,指定された時間帯のみで取引する.
第4ステップ,トレーリングストップメカニズム.最新のATR位置に応じて,リアルタイムでストップを調整し,より多くの利益をロックする.
優位分析
ボール帯指数は単一の移動平均よりも効率的に価格の中心を反映します.
ATRのストップローンは,単一利益率を制御し,リスクを効果的に制御します.
トレーリングストップは,市場の変動に応じて自動的に調整され,より多くの利益を固定します.
カスタマイズ可能なパーソナライズされたポートフォリオの豊富な策略パラメータ.
リスク分析
大波の調整では,小規模な損失が繰り返し発生する可能性があります.
ボール帯の突破は逆転し,失敗するかもしれない.
夜と重要なニュースの時期に取引する際にはリスクが高いので,注意してください.
対策として
- リスク管理の原則を厳格に遵守し,単一損失を制御する.
- 勝率を上げるためにパラメータを最適化する
- リスクの高い時間帯にタイムフィルターを使用してください.
最適化の方向
- 異なるパラメータの組み合わせの最適化配置をテストする
- OBVなどの熱指数を増やす
- 機械学習モジュールの最適化
要約する
この戦略は,トレンドの中央と突破方向を判断するボール帯の指標を総合的に使用し,ATR指標は,ストップ・ロスを計算し,ストップ・ロスを保証し,利益をロックします.戦略の優点は,高度にカスタマイズでき,リスクが制御でき,短線イントラデイ取引に適しています.パラメータの最適化と機械学習は,戦略の勝利率と収益性をさらに向上させることができます.
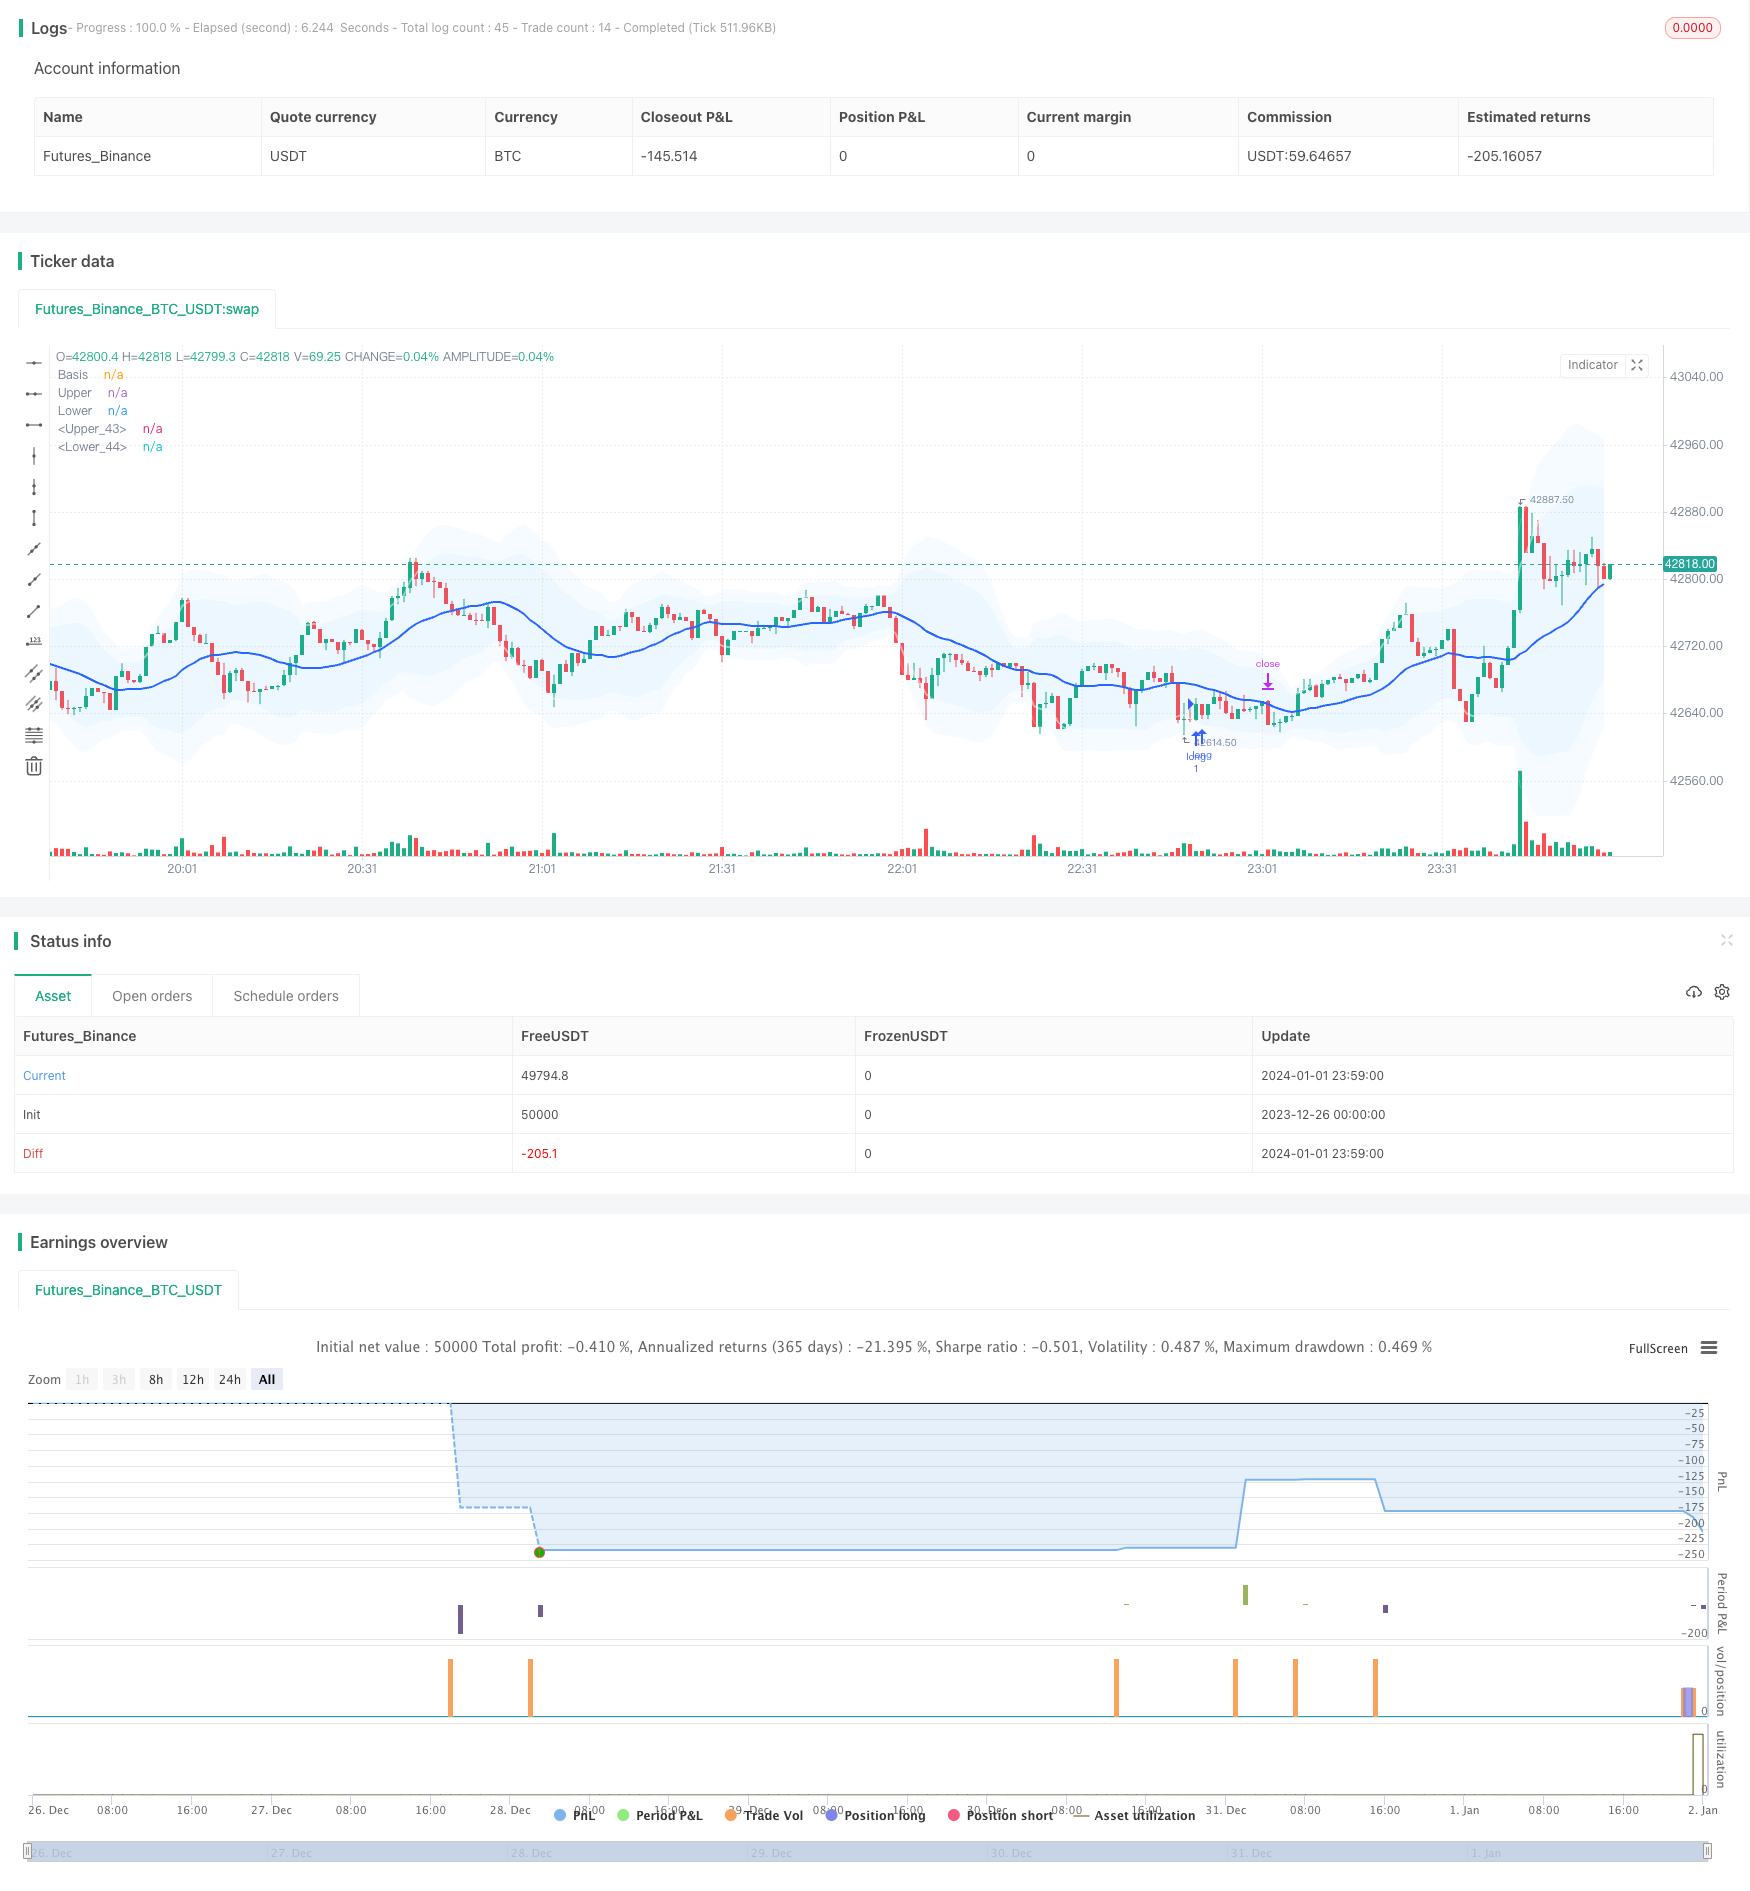
/*backtest
start: 2023-12-26 00:00:00
end: 2024-01-02 00:00:00
period: 1m
basePeriod: 1m
exchanges: [{"eid":"Futures_Binance","currency":"BTC_USDT"}]
*/

// This source code is subject to the terms of the Mozilla Public License 2.0 at https://mozilla.org/MPL/2.0/
// © sadeq_haddadi

//@version=5

strategy('Bollinger Bands + ATR / trail- V2', overlay=true ) // Interactive Brokers rate)


//date and time
startDate   = input(title="Start Date", defval=timestamp("01 Aug 2023 00:00 +0000"), tooltip="Date & time to begin analysis",group = 'Time Filter')
endDate     = input(title="End Date", defval=timestamp("1 Jan 2099 00:00 +0000"), tooltip="Date & time to stop analysis")
timeSession = input(title="Time Session To Analyze", defval="0300-1700", tooltip="Time session to analyze")
inSession(sess) => true

// indicators

length = input.int(20, minval=1,group = 'Bollinger Band')
maType = input.string("SMA", "Basis MA Type", options = ["SMA", "EMA", "SMMA (RMA)", "WMA", "VWMA"])
src = input(close, title="Source")
mult1 = input.float(2.0, minval=0.001, maxval=50, title="StdDev1")
mult2 = input.float(3.0, minval=0.001, maxval=50, title="StdDev2")

ma(source, length, _type) =>
    switch _type
        "SMA" => ta.sma(source, length)
        "EMA" => ta.ema(source, length)
        "SMMA (RMA)" => ta.rma(source, length)
        "WMA" => ta.wma(source, length)
        "VWMA" => ta.vwma(source, length)

basis = ma(src, length, maType)
dev1 = mult1 * ta.stdev(src, length)
dev2 = mult2 * ta.stdev(src, length)
upper1 = basis + dev1
lower1 = basis - dev1
upper2 = basis + dev2
lower2 = basis - dev2
offset = input.int(0, "Offset", minval = -500, maxval = 500)
plot(basis, "Basis", color=#2962FF, offset = offset,linewidth=2)
p1 = plot(upper1, "Upper", color=color.new(color.white,50), offset = offset,linewidth=2)
p2 = plot(lower1, "Lower", color=color.new(color.white,50), offset = offset,linewidth=2)
p3 = plot(upper2, "Upper", color=color.new(color.white,80), offset = offset,linewidth=1)
p4 = plot(lower2, "Lower", color=color.new(color.white,80), offset = offset,linewidth=1)

fill(p1, p2, title = "Background", color=color.rgb(33, 150, 243, 95))
fill(p3, p4, title = "Background", color=color.rgb(33, 150, 243, 95))

show_crosses = input(false, "Show Cross the Bands?")

plotshape(show_crosses and ta.crossover(close, upper2)  ? src : na, "S", style = shape.triangledown, location =location.abovebar, color = color.yellow, size = size.tiny)
plotshape(show_crosses and ta.crossunder(low, lower2) ? src : na ,"L", style = shape.triangleup, location =  location.belowbar, color = color.purple, size = size.tiny)

second_entry = input(true, "Show second deviation entry point?")

//atr

length_ATR = input.int(title="Length", defval=5, minval=1,group = 'ATR')
smoothing = input.string(title="Smoothing", defval="RMA", options=["RMA", "SMA", "EMA", "WMA"])
m = input.float(1, "Multiplier")
src1 = input(high)
src2 = input(low)
pline = input.bool(title = 'show ATR lines ?', defval=false)


ma_function(source, length_ATR) =>
	if smoothing == "RMA"
		ta.rma(source, length_ATR)
	else
		if smoothing == "SMA"
			ta.sma(source, length_ATR)
		else
			if smoothing == "EMA"
				ta.ema(source, length_ATR)
			else
				ta.wma(source, length_ATR)

a = ma_function(ta.tr(true), length_ATR) * m
x = ma_function(ta.tr(true), length_ATR) * m + src1
x2 = src2 - ma_function(ta.tr(true), length_ATR) * m

PP1 = plot(pline ? x :na , title = "ATR Short Stop Loss", color= color.new(color.red,20) )
PP2 = plot(pline ? x2:na , title = "ATR Long Stop Loss",  color=color.new(color.green,20) )

Tp_to_Sl = input.float(1.5, "TP/SL")
candle_size =  input.float(10, "candle/pip")
distance_source =  input.float(1.5, "distance to midline/pip")
//strategy

buyCondition = low[2] < lower1 and  ta.crossover(close[1], lower1)  and strategy.position_size == 0 and (close[1] - open[1]) < candle_size * 0.0001 and close > open and ( basis - close) > distance_source * 0.0001

sellCondition = high[2] > upper1 and ta.crossunder(close[1], upper1)  and strategy.position_size == 0 and (open[1] - close[1]) < candle_size * 0.0001 and close < open  and (close - basis) > distance_source * 0.0001
//
buyCondition2 = low[2] < lower2 and  ta.crossover(close[1], lower2)  and (close[1] - open[1]) < candle_size * 0.0001 and close > open and ( basis - close) > distance_source * 0.0001
sellCondition2 = high[2] > upper2 and ta.crossunder(close[1], upper2)   and (open[1] - close[1]) < candle_size * 0.0001 and close < open  and (close - basis) > distance_source * 0.0001

plotshape(second_entry and  sellCondition2 ? src : na, "S", style = shape.triangledown, location =location.abovebar, color = color.rgb(241, 153, 177), size = size.tiny)
plotshape(second_entry and buyCondition2 ? src : na ,"L", style = shape.triangleup, location =  location.belowbar, color = color.rgb(177, 230, 168), size = size.tiny)
//
since_buy  =ta.barssince(buyCondition)
since_sell =ta.barssince(sellCondition)
entry_price = ta.valuewhen(buyCondition or sellCondition, src, 0)

sl_long = ta.valuewhen(buyCondition, x2[1], 0)
sl_short = ta.valuewhen(sellCondition, x[1], 0)
buyprofit = entry_price + (Tp_to_Sl*( entry_price - sl_long))
sellprofit= entry_price + (Tp_to_Sl*( entry_price - sl_short))

//alert_massage = "new strategy position is {{strategy.position_size}}"
//prof = ta.crossover(high,upper1)
//buyexit=ta.valuewhen(prof,upper1,0)

if buyCondition and inSession(timeSession)

    strategy.entry( id = "long", direction = strategy.long , alert_message='Open Long Position' )

if sellCondition and inSession(timeSession)

    strategy.entry(id= "short", direction = strategy.short, alert_message='Open Short Position')

//trail-stop loss
use_trailing = input.bool(title = 'use trailing stop loss?', defval=true)
pricestop_long=0.00
pricestop_short=100000.00
if (strategy.position_size > 0)

    if use_trailing == false
        pricestop_long := sl_long
    else
        pricestop_long := math.max (x2, pricestop_long[1]) //trail - long

if (strategy.position_size < 0)

    if use_trailing == false
        pricestop_short := sl_short
    else
        pricestop_short := math.min (x, pricestop_short[1])  // trail - short

if strategy.position_size > 0

    strategy.exit(id = 'close', limit =  buyprofit , stop = pricestop_long  )

if strategy.position_size < 0

    strategy.exit(id = 'close', limit = sellprofit  , stop = pricestop_short  )

alertcondition(buyCondition or sellCondition, 'Enter_position')