移動平均クロスオーバーシステム
作成日:
2024-01-03 16:22:18
最終変更日:
2024-01-03 16:22:18
コピー:
2
クリック数:
669
1
フォロー
1750
フォロワー
概要
この戦略は,多空の順位トレード戦略で,移動平均の金叉死叉をベースに取引信号を形成する. 急速移動平均が,下からゆっくり移動平均を貫くとき,買入信号を生成する. 急速移動平均が,上から下からゆっくり移動平均を貫くとき,売り信号を生成する.
戦略原則
この戦略は,2つの移動平均,すなわち20日間のシンプル移動平均と30日間のシンプル移動平均を使用する.20日間の移動平均が30日間の移動平均を上から穿越すると,買入シグナルが生じ,20日間の移動平均が30日間の移動平均を上から穿越すると,売り込みシグナルが生じる.
移動平均線は,それ自体がトレンド指数であり,市場トレンドの方向を効果的に描写することができる.交差原理は,この戦略をトレンドの転換点をタイムリーに捉え,取引シグナルを形成できるようにする.20日と30日の2つの周期長さを適切に設定すると,市場トレンドを反映し,過度に敏感で誤ったシグナルを生成しない.
優位分析
この戦略の利点は以下の通りです.
- 戦略の論理はシンプルで明快で,理解し,実行しやすく,初心者向けに適しています.
- 逆勢を避けるため,余計な損失を減らすために,順位取引を行うこと.
- 移動平均線は,それ自体がフィルタリング作用を持ち,状況の騒音を排除し,誤った信号を生じさせないようにします.
- 周期パラメータの設定は合理的で,戦略の安定性に影響しない.
リスク分析
この戦略には以下のリスクがあります.
- 変動の時には,移動平均が頻繁に交差し,多くのストップ・リストが生じることがあります.
- 移動平均はトレンドの時に遅れているので,利益の一部を逃す可能性があります.
- パラメータが設定されていない場合,戦略の安定性に影響を与える.
対策として
- 移動平均周期の調整,三角移動平均などの技術を用いて曲線を平らにし,交差の頻度を減らす.
- 他の指標でトレンドを判断し,不安定な状況で取引を避ける.
- パラメータを最適化して,最適なパラメータの組み合わせを探します.
最適化の方向
この戦略は,以下のような点で最適化できます.
- 異なる種類の移動平均を試す:加重移動平均,三角移動平均など
- 他の技術指標の判断を増やして,波動的な市場の中で取引シグナルの発生を防ぐこと.
- 波理論やチャネル理論などの技術分析方法と組み合わせた市場動向を判断する.
- マシン・ラーニングなどのモデルのリアルタイム最適化パラメータを採用する.
- 定量化ツールと組み合わせて,ストップ・ストップ・損失戦略を導入し,資金管理を最適化する.
要約する
移動平均クロスシステムは,シンプルで効果的なトレンド追跡戦略であり,原理は明確で,容易に理解でき,初心者の学習に最適である.この戦略は,主に移動平均の金叉死叉を頼って取引信号を形成し,順位取引によって利益を得ます.多方面から最適化することができ,戦略をより安定して効率的にします.
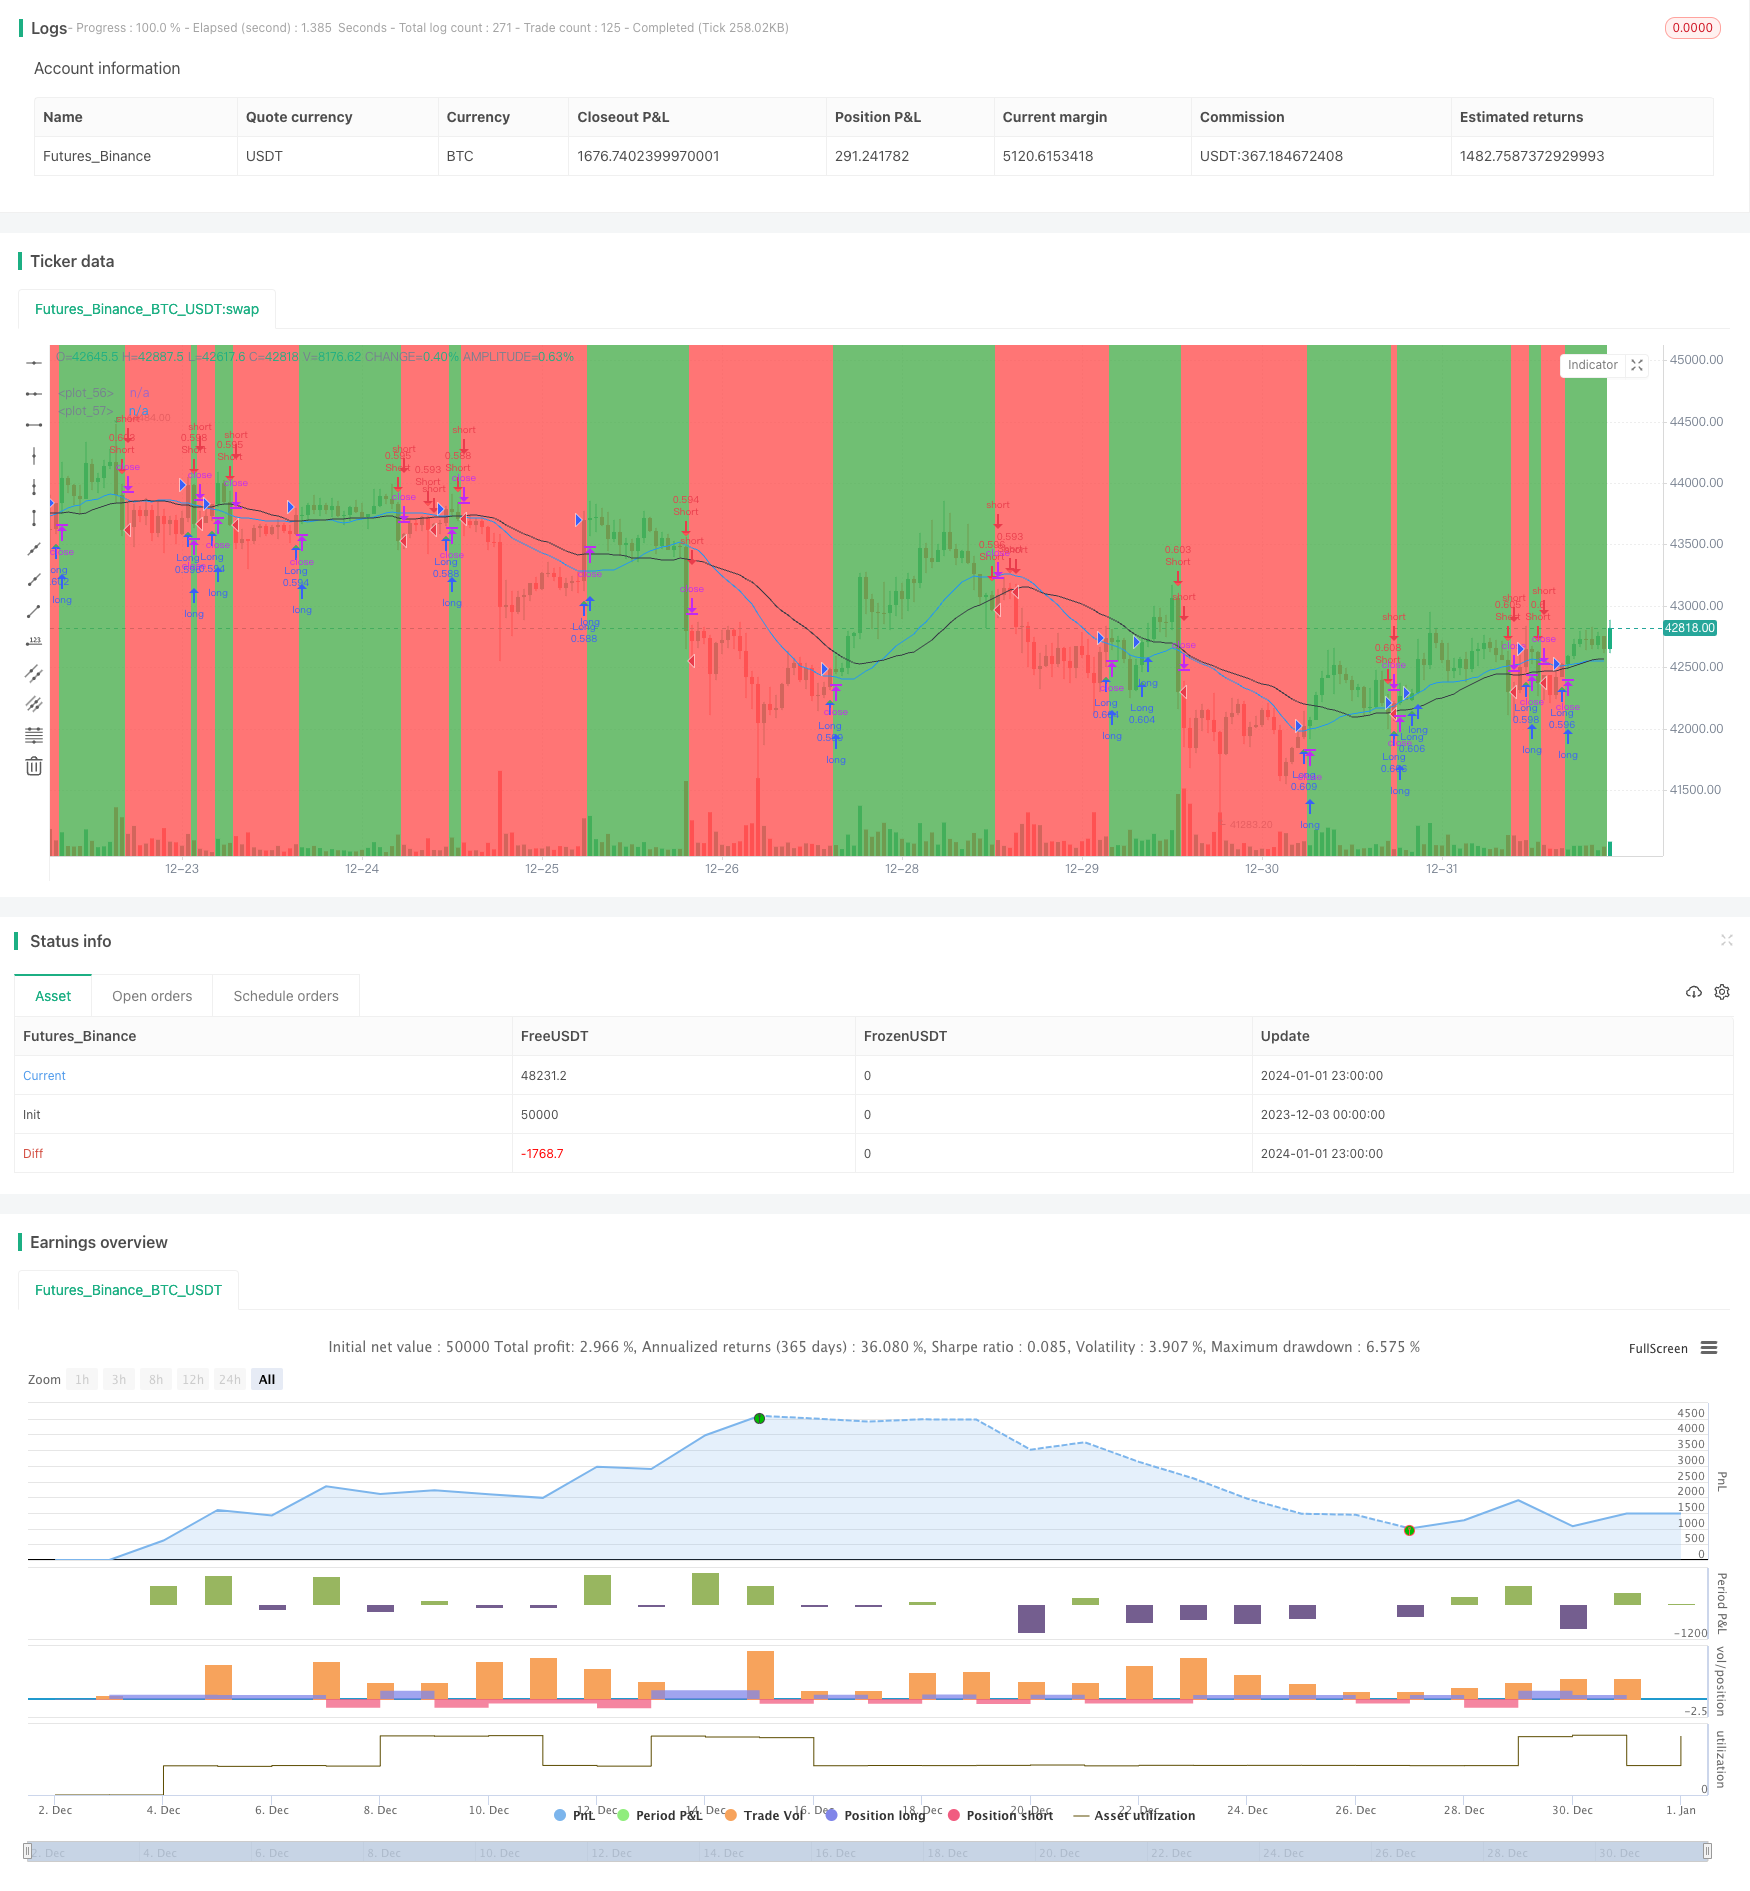
ストラテジーソースコード
/*backtest
start: 2023-12-03 00:00:00
end: 2024-01-02 00:00:00
period: 1h
basePeriod: 15m
exchanges: [{"eid":"Futures_Binance","currency":"BTC_USDT"}]
*/

// This source code is subject to the terms of the Mozilla Public License 2.0 at https://mozilla.org/MPL/2.0/
// © gliese581d

//@version=4
strategy(title="Moving Averages Testing", overlay=true, precision=2, calc_on_every_tick=false, max_bars_back=5000, pyramiding=2,
 default_qty_type=strategy.percent_of_equity, default_qty_value=50, commission_type=strategy.commission.percent, initial_capital=10000)


//SETTINGS

longs_on = input(title="Long Trades enabled", defval=true)
shorts_on = input(title="Short Trades enabled", defval=true)

long_cond = input(title="Buy/Long Crossover Condition", defval="price x MA1", options=["price x MA1", "price x MA2", "MA1 x MA2"])
short_cond = input(title="Sell/Short Crossunder Condition", defval="price x MA2", options=["price x MA1", "price x MA2", "MA1 x MA2"])

ma1_type = input(title="Moving Average 1 Type", defval="SMA", options=["SMA", "EMA"])
ma1_len = input(defval=20, title="Moving Average 1 Len", type=input.integer, minval=1, maxval=1000, step=1)
ma2_type = input(title="Moving Average 2 Type", defval="SMA", options=["SMA", "EMA"])
ma2_len = input(defval=30, title="Moving Average 2 Len", type=input.integer, minval=1, maxval=1000, step=1)


//MOVING AVERAGES

ma_1 = ma1_type == "EMA" ? ema(close, ma1_len) : sma(close, ma1_len)
ma_2 = ma2_type == "EMA" ? ema(close, ma2_len) : sma(close, ma2_len)


//STRATEGY

//trade entries
long_entry = long_cond == "price x MA1" ? crossover(close, ma_1) : long_cond == "price x MA2" ? crossover(close, ma_2) : long_cond == "MA1 x MA2" ? crossover(ma_1, ma_2) : false
short_entry = short_cond == "price x MA1" ? crossunder(close, ma_1) : short_cond == "price x MA2" ? crossunder(close, ma_2) : short_cond == "MA1 x MA2" ? crossunder(ma_1, ma_2) : false

start_month = input(defval=4, title="Strategy Start Month", type=input.integer, minval=1, maxval=12, step=1)
start_year = input(defval=2018, title="Strategy Start Year", type=input.integer, minval=2000, maxval=2025, step=1)
end_month = input(defval=12, title="Strategy End Month", type=input.integer, minval=1, maxval=12, step=1)
end_year = input(defval=2020, title="Strategy End Year", type=input.integer, minval=2000, maxval=2025, step=1)

in_time =true

strategy.entry("Long", strategy.long, when=longs_on and in_time and long_entry)
strategy.close("Long", when=longs_on and not shorts_on and short_entry)

strategy.entry("Short", strategy.short, when=shorts_on and in_time and short_entry)
strategy.close("Short", when=shorts_on and not longs_on and long_entry)


//PLOTTING

//color background
last_entry_was_long = nz(barssince(long_entry)[1], 5000) < nz(barssince(short_entry)[1], 5000)
bgcol = (longs_on and last_entry_was_long) ? color.green : (shorts_on and not last_entry_was_long) ? color.red : na
bgcolor(color=bgcol, transp=90)

plot((long_cond == "price x MA1" or long_cond == "MA1 x MA2") or (short_cond == "price x MA1" or short_cond == "MA1 x MA2") ? ma_1 : na, color=color.blue)
plot((long_cond == "price x MA2" or long_cond == "MA1 x MA2") or (short_cond == "price x MA2" or short_cond == "MA1 x MA2") ? ma_2 : na, color=color.black)
plotshape(long_entry, style=shape.triangleup, location=location.belowbar, color=color.green)
plotshape(short_entry, style=shape.triangledown, location=location.abovebar, color=color.red)