ストレス指標追跡戦略
作成日:
2024-01-12 11:43:08
最終変更日:
2024-01-12 11:43:08
コピー:
4
クリック数:
671
1
フォロー
1750
フォロワー
概要
プレッシャー指標追跡戦略は,Dr.Alexander ElderのElder Ray指標に基づいて設計され,市場の買入と売却の圧力を測定する.この戦略は,市場価値の合意を表す13日指数移動平均を採用し,プレッシャー指標を使用して,売り手の価格を合意値を下げる能力を測定する.
戦略原則
この戦略の核心指標は,その日の最低価格を引いた13日指数移動平均から計算される負圧指標である.負圧指標は,指定された値の穿戴時に多めに,下穿時に空にする.それは,平均合意値よりも価格を低めに圧迫する売り手の能力を反映する.
さらに,多空方向は,取引反転パラメータを切り替えることもできる。このパラメータはブル型で,デフォルトではFalse。それがTrueであるとき,信号が出る時に反転操作を行う。
この戦略はシンプルで実用的で,1つの指標によって多空方向を判断し,容易に実現する.
優位分析
この戦略の利点は以下の通りです.
- シンプルで理解し,適用しやすく,単一の指標を使用します.
- 柔軟に調整可能なパラメータ,異なる市場環境に適用
- 選択可能な反転取引,富裕な戦略タイプ
リスク分析
この戦略にはいくつかのリスクがあります.
- 単一の指標は 偽信号を生成する
- ストップ・ロスを考慮しないことにより,大きな損失が発生する可能性があります.
- パラメータを間違えると,取引が頻発する可能性があります.
複数の指標の確認,停止の設定,パラメータの調整などによりさらに最適化できます.
最適化の方向
この戦略を最適化できるいくつかの方向:
- MACD,KDJなどの他の指標のフィルタリング信号を追加し,偽突破を避ける
- 損失を制限するために移動停止を加える
- メインパラメータの最適化,入場・出場の調整
- 株の基本面と組み合わせた 株の選択を考える
- 他の戦略の組み合わせで使用できます
要約する
負圧指数追跡戦略の概念はシンプルで,単一の指数と指定された値を比較して入場と出場を判断し,操作は簡単である.しかし,指数ベースの戦略として,最適化できるスペースは広大であり,指数,ストップ損失,株式選などから総合的に最適化することができ,戦略をより安定的に信頼できます.
ストラテジーソースコード
/*backtest
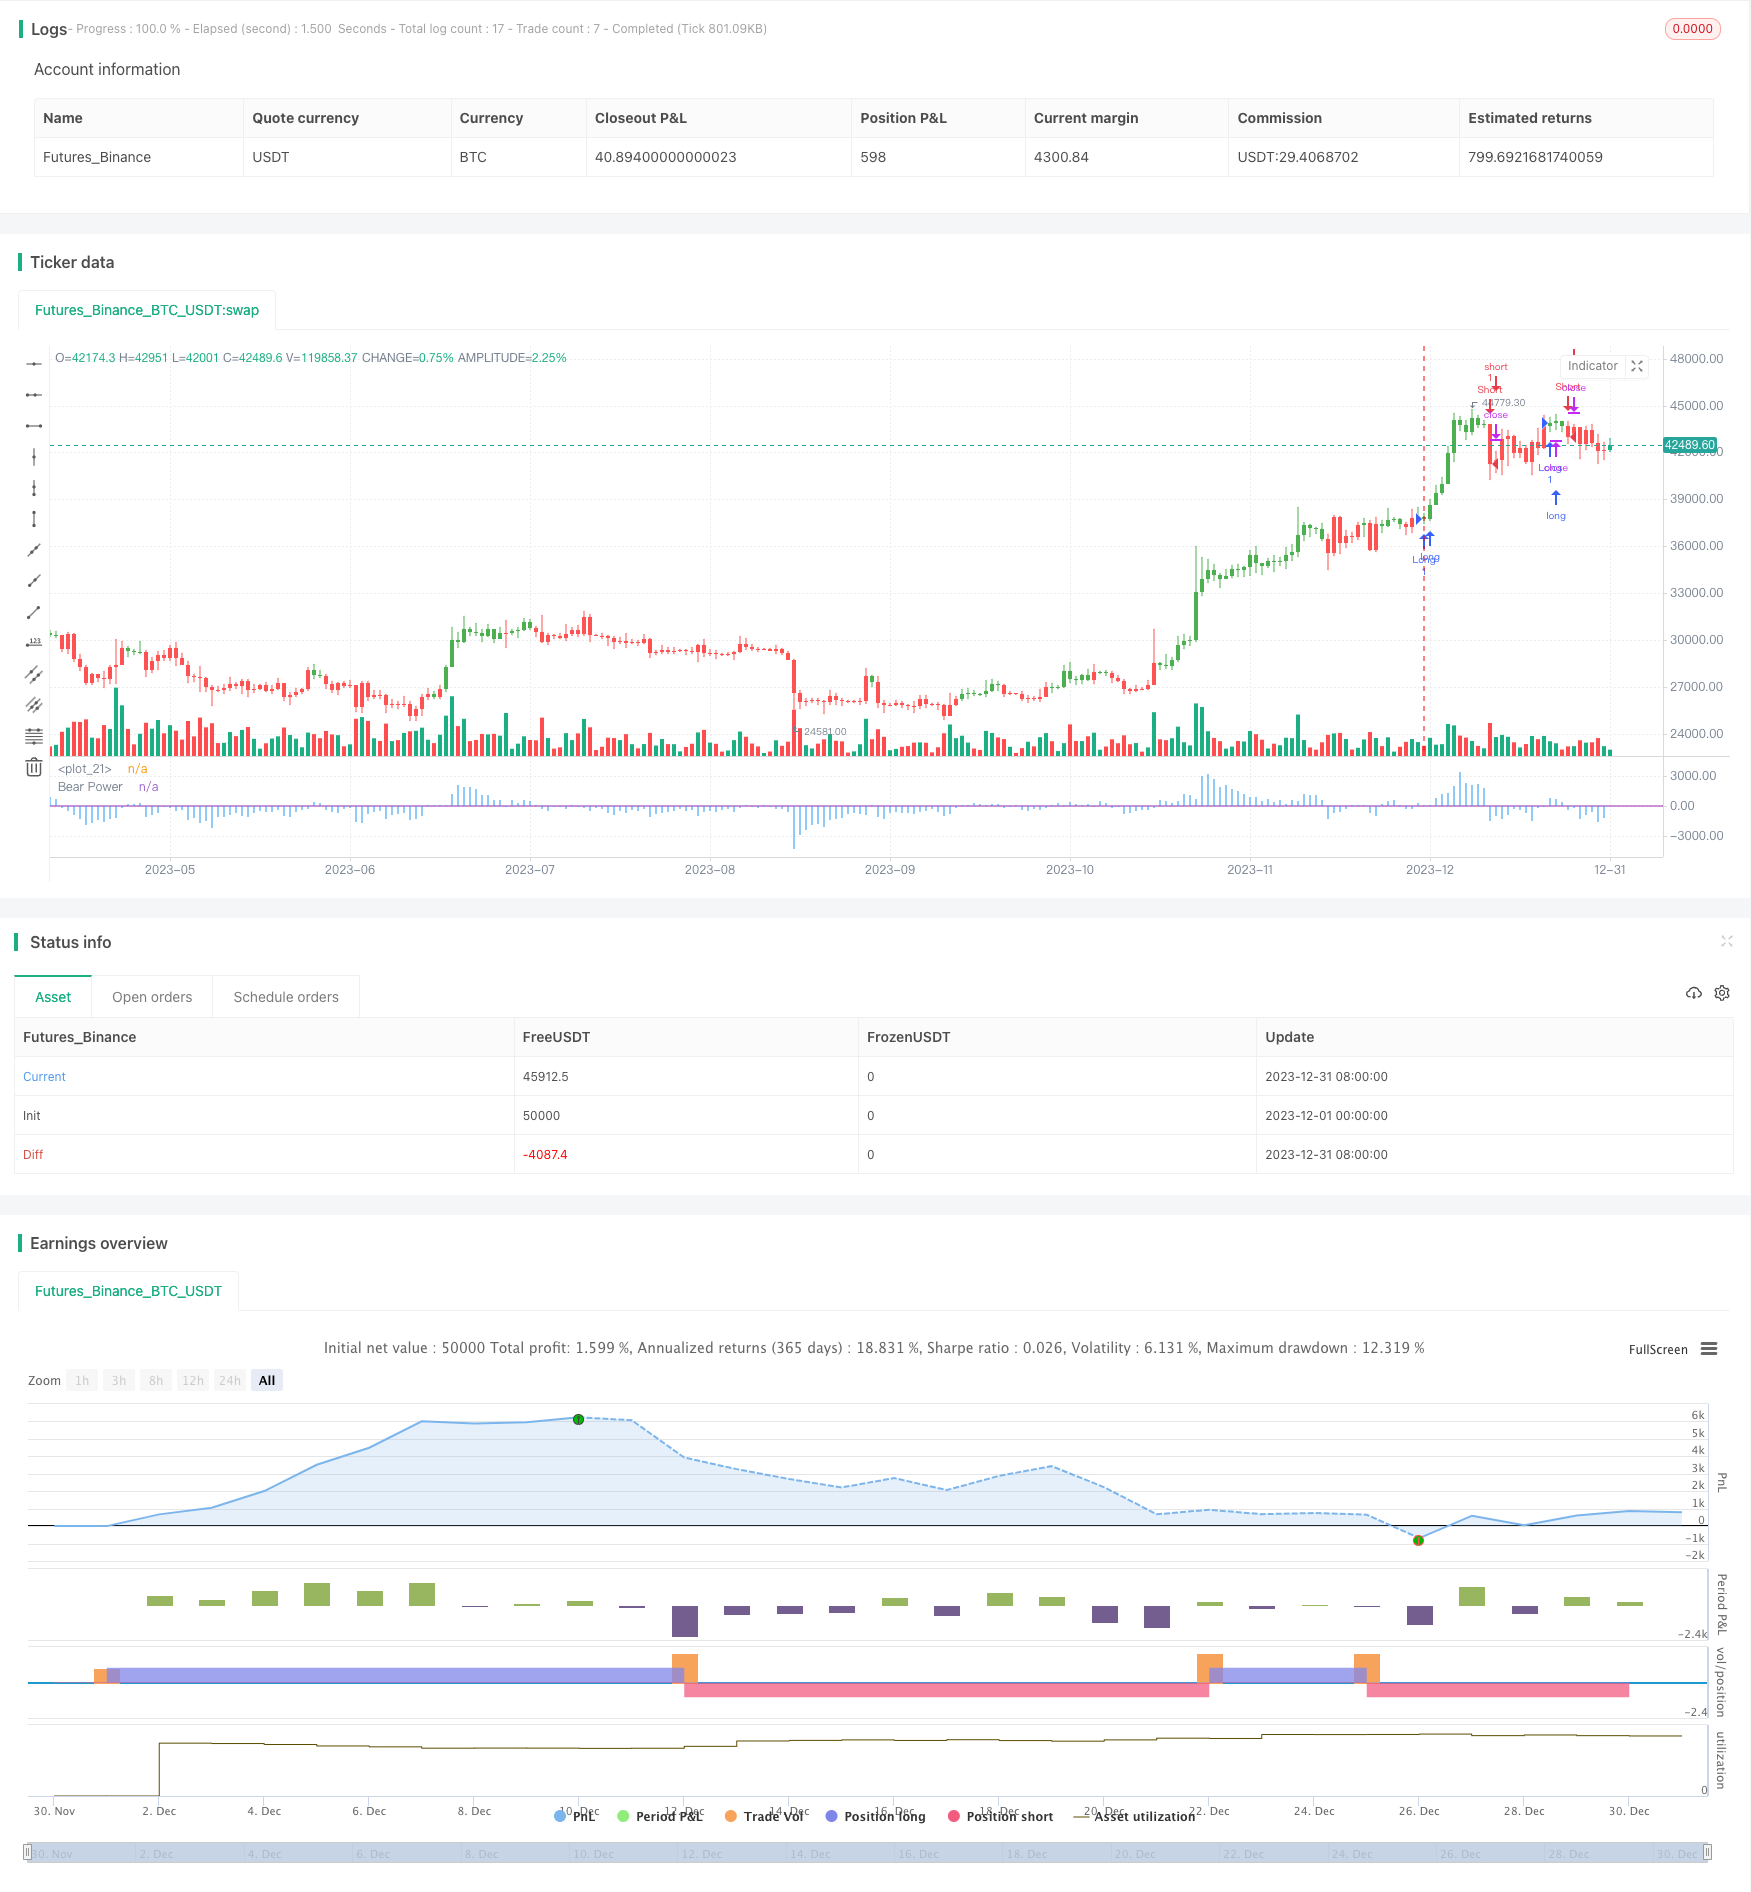
start: 2023-12-01 00:00:00
end: 2023-12-31 23:59:59
period: 1d
basePeriod: 1h
exchanges: [{"eid":"Futures_Binance","currency":"BTC_USDT"}]
*/
//@version = 2
////////////////////////////////////////////////////////////
// Copyright by HPotter v1.0 07/12/2016
// Developed by Dr Alexander Elder, the Elder-ray indicator measures buying
// and selling pressure in the market. The Elder-ray is often used as part
// of the Triple Screen trading system but may also be used on its own.
// Dr Elder uses a 13-day exponential moving average (EMA) to indicate the
// market consensus of value. Bear Power measures the ability of sellers to
// drive prices below the consensus of value. Bear Power reflects the ability
// of sellers to drive prices below the average consensus of value.
// Bull Power is calculated by subtracting the 13-day EMA from the day's High.
// Bear power subtracts the 13-day EMA from the day's Low.
// You can use in the xPrice any series: Open, High, Low, Close, HL2, HLC3, OHLC4 and ect...
// You can change long to short in the Input Settings
// Please, use it only for learning or paper trading. Do not for real trading.
////////////////////////////////////////////////////////////
strategy(title="Elder Ray (Bear Power) Strategy Backtest")
Length = input(13, minval=1)
Trigger = input(0)
reverse = input(false, title="Trade reverse")
hline(0, color=purple, linestyle=line)
xPrice = close
xMA = ema(xPrice,Length)
DayLow = iff(dayofmonth != dayofmonth[1], low, min(low, nz(DayLow[1])))
nRes = DayLow - xMA
pos = iff(nRes > Trigger, 1,
iff(nRes < Trigger, -1, nz(pos[1], 0)))
possig = iff(reverse and pos == 1, -1,
iff(reverse and pos == -1, 1, pos))
if (possig == 1)
strategy.entry("Long", strategy.long)
if (possig == -1)
strategy.entry("Short", strategy.short)
barcolor(possig == -1 ? red: possig == 1 ? green : blue )
plot(nRes, color=blue, title="Bear Power", style = histogram)