ダイナミックサンタクロースリターン戦略
作成日:
2024-01-12 14:00:00
最終変更日:
2024-01-12 14:00:00
コピー:
2
クリック数:
647
1
フォロー
1750
フォロワー
概要
ダイナミック・サンタクロース・リバース戦略は,価格と柱線インデックスの間のダイナミック・リバース関係に基づいて,潜在的な入場と出場のポイントを識別する量的な取引戦略である.この戦略は,長さ調整可能なパラメータのダイナミック・平均線を使用して,価格のリバース・トレンド・ラインを描く.リバース・ラインの方向を分析して,入場か出場かを判断する.
戦略原則
この戦略の核心は,価格と柱線インデックスの間の線形回帰関係を計算することである.まずは,長さNの単純な移動平均と標準差を計算する.それから,サンプル関連系数と標準差比値に基づいて,回帰線の斜率kと断面bを計算する.これにより,動的に調整された線形回帰方程式が得られる:
y = kx + b
xは柱のインデックスで,yは価格である.
回帰線の現在の瞬間と前瞬間の大きさの関係によって,トレンドの方向を判断する.回帰線が上昇し,閉盘価格が開盘価格と前瞬間最高価格より高くなったら,買入シグナルを生成する.回帰線が低下し,閉盘価格が開盤価格と前瞬間最低価格より低くなったら,売出シグナルを生成する.
戦略的優位性
- 動的パラメータを設定し,Nの値を調整することで,異なる周期の価格変動に対応できます.
- 回帰関係は,時間の影響を考慮し,価格の傾向性を反映します.
- 複数の条件判断を組み合わせて取引信号を生成し,誤解を避ける
- 価格の逆転傾向を直感的に表示し,はっきりと読める
リスクと解決策
- N値が正しく設定されず,回帰線が滑らかすぎたり,敏感すぎたりする可能性があります.
- 解決策:N値を調整し,最適なバランスを探す
- 短期的な価格変動,帰帰関係判断の失敗
- 解決策は 他の指標と組み合わせて 入場点をフィルターすることです
- 環比は1つの時間点のみを考慮し,局所的な極限値を見逃す可能性があります.
- 解決策: 適切な緩和区間を設け 誤判を避ける
最適化の方向
- ダイナミックな退出メカニズムを追加し,回帰関係によるストップポイントの調整
- 取引量などの指標と組み合わせたシグナル検証により,誤った取引を減らす
- マシン・ラーニングの手法により,より広範な市場環境に対応してパラメータを自動最適化
- グラフィックの追加により,戦略の効果がより直感的に示されます.
要約する
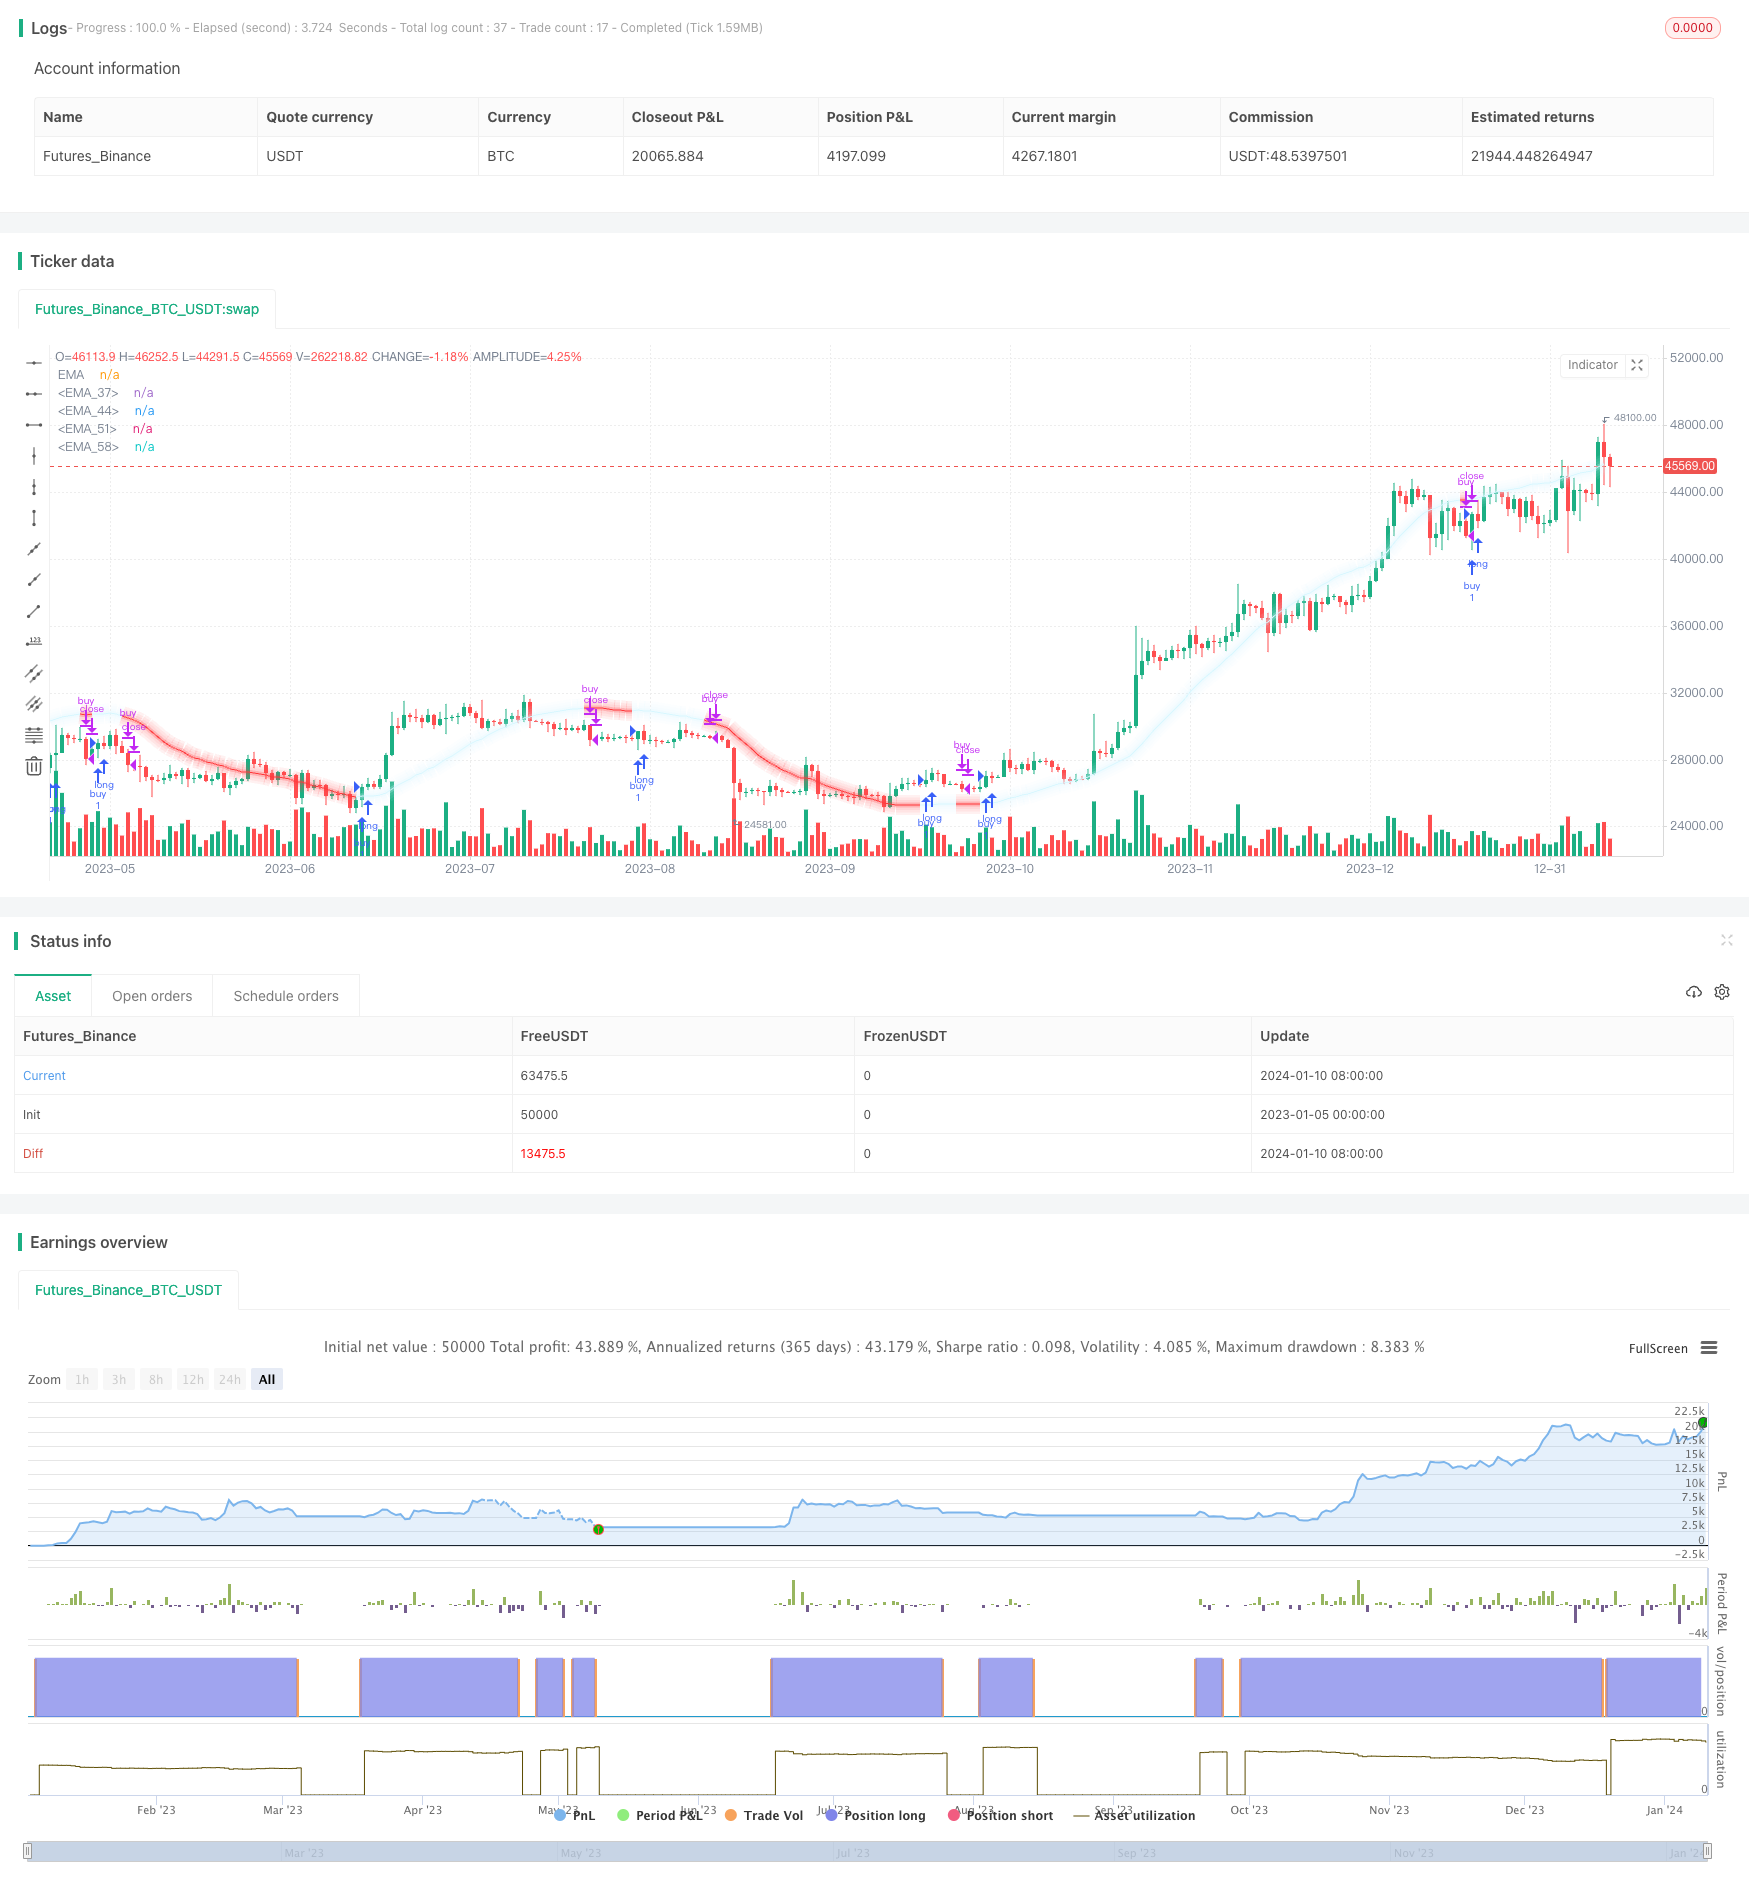
動的サンタクロース回帰策は,価格と時間の動的回帰関係を利用し,柔軟で直感的でパラメータ調整可能な量化取引システムを実現する.この策の論理は明確で,容易に理解でき,パラメータを最適化することで,異なる取引製品と周期に適用できる.この策の革新は,時間要因を導入して動的モデルを構築することで判断をより傾向的にする.全体的に,この策は量化取引に参考に値するサンプルを提供する.
ストラテジーソースコード
/*backtest
start: 2023-01-05 00:00:00
end: 2024-01-11 00:00:00
period: 1d
basePeriod: 1h
exchanges: [{"eid":"Futures_Binance","currency":"BTC_USDT"}]
*/

//@version=5
// Creator - TradeAI
strategy('Moving Santa Claus Strategy | TradeAI', overlay=true)

// Set the length of the moving average
length = input(64)

// Calculate the moving averages and standard deviations
x = bar_index
y = close
x_ = ta.sma(x, length)
y_ = ta.sma(y, length)
mx = ta.stdev(x, length)
my = ta.stdev(y, length)
c = ta.correlation(x, y, length)
slope = c * (my / mx)

// Calculate the parameters of the regression line
inter = y_ - slope * x_
reg = x * slope + inter

// Set the line color based on whether EMA is moving up or down
var color lineColor = na
if (reg > reg[1] and (close > open and close > high[1]))
    lineColor := color.new(#d8f7ff, 0)
if (reg < reg[1] and (close < open and close < low[1]))
    lineColor := color.new(#ff383b, 0)

// Plot the EMA line with different thicknesses
plot(reg, color=lineColor, title="EMA")

var color lineColorrr = na
if (reg > reg[1] and (close > open and close > high[1]))
    lineColorrr := color.new(#d8f7ff, 77)
if (reg < reg[1] and (close < open and close < low[1]))
    lineColorrr := color.new(#ff383b, 77)
plot(reg, color=lineColorrr, title="EMA", linewidth=5)

var color lineColorr = na
if (reg > reg[1] and (close > open and close > high[1]))
    lineColorr := color.new(#d8f7ff, 93)
if (reg < reg[1] and (close < open and close < low[1]))
    lineColorr := color.new(#ff383b, 93)
plot(reg, color=lineColorr, title="EMA", linewidth=10)

var color lineColorrrr = na
if (reg > reg[1] and (close > open and close > high[1]))
    lineColorrrr := color.new(#d8f7ff, 97)
if (reg < reg[1] and (close < open and close < low[1]))
    lineColorrrr := color.new(#ff383b, 97)
plot(reg, color=lineColorr, title="EMA", linewidth=15)

var color lineColorrrrr = na
if (reg > reg[1] and (close > open and close > high[1]))
    lineColorrrrr := color.new(#d8f7ff, 99)
if (reg < reg[1] and (close < open and close < low[1]))
    lineColorrrrr := color.new(#ff383b, 99)
plot(reg, color=lineColorr, title="EMA", linewidth=20)

// Implement trading strategy based on EMA direction
if reg > reg[1] and (close > open and close > high[1])
    strategy.entry('buy', strategy.long)

if reg < reg[1] and (close < open and close < low[1])
    strategy.close('buy')