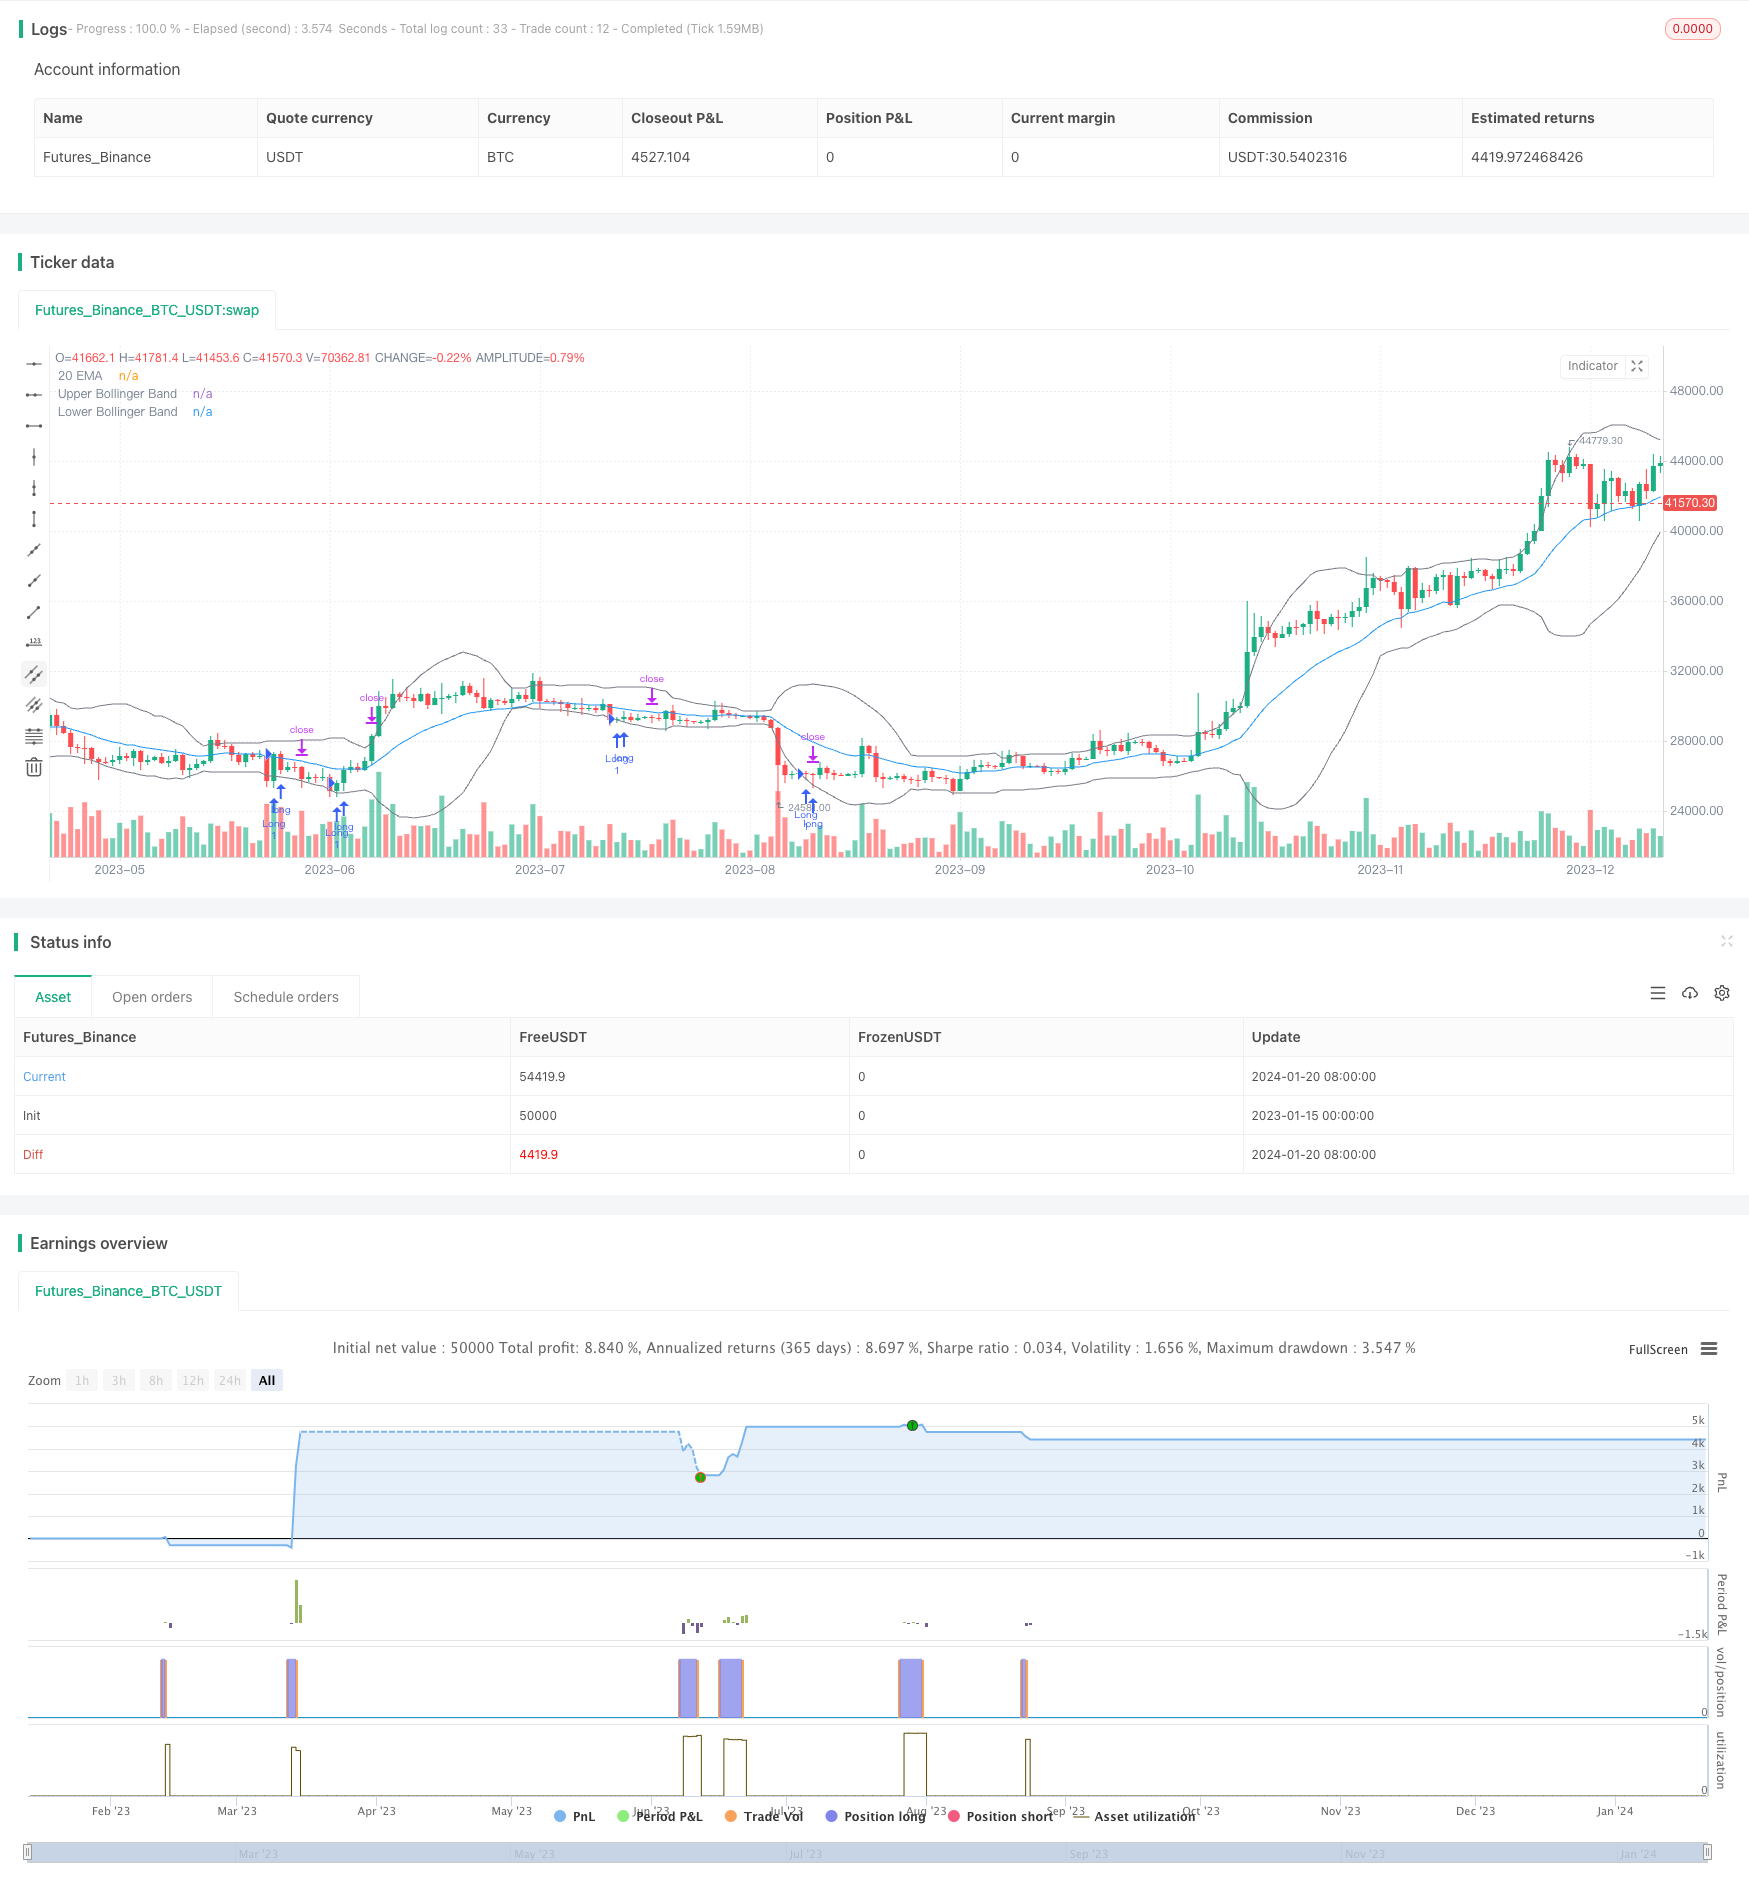
ボリンジャーバンドチャネルに基づくブレイクアウト回帰戦略
作成日:
2024-01-22 10:47:45
最終変更日:
2024-01-22 10:47:45
コピー:
0
クリック数:
622
1
フォロー
1750
フォロワー
概要
この戦略はブリン帯通路の回帰突破戦略に基づいている. 価格がブリン帯通路下線を突破したとき,長引入を行う. ストップ・ロスは入場突破点の最低価格として設定される. ストップ・ストップはブリン帯上線を目標とする.
戦略原則
この戦略は20周期のブリン帯通路を使用する。ブリン帯通路は中軌,上軌,下軌で構成されている。中軌は20周期の単純移動平均であり,上軌は中軌加算の標準差の2倍,下軌は中軌減算の標準差の2倍で構成されている。
価格が下落すると,価格が超売り状態に入ったことを示し,このとき長ポジションの入場が行われます.入場後,ストップ・プールは入場時にK線の最低価格として設定され,ストップ・プールはブリン帯を軌道に乗せます.このように,戦略は,価格を超売り状態から均線に戻す過程を追跡し,利益を上げることです.
戦略的優位分析
この戦略の利点は以下の通りです.
- ブリン・ベルト・チャネルを活用して,市場を過買過売状態で判断し,時効性がある.
- ドックネームの追いつくのを避けるために,取引戦略に戻る
- ストップ・ストップ・ポイントの設定は合理的で,リスク管理に有利である
リスク分析
この戦略にはいくつかのリスクがあります.
- ブリン帯は価格の動向を正確に判断できず,下位から反発するとは限りません.
- 大盘が下がり続ける場合,Floating P/Lが最初にストップを誘発する可能性があります.
- 停止点は上線に近いので,停止コストが高くなるリスクがある.
戦略最適化の方向性
この戦略は以下の点で最適化できます.
- ブリン帯のパラメータを最適化して,最適なパラメータの組み合わせを探します.
- 他の指標のフィルタリング信号を追加して,入場精度を向上させる
- ストップ・ストップ・損失戦略の最適化と利益率の向上
要約する
この戦略の全体的な考え方は明確で,ある程度の操作性がある。しかし,ブリン帯を利用して超買い超売り判断するタイミングは高くないため,価格トレンドを完璧に判断することはできない。さらに,ストップ・ストップ・損失機構も最適化される必要がある。後に,より正確な指標,最適化パラメータ,およびストップ・ストップ・損失機構の改善などから最適化して,戦略の収益性を向上させることができる。
ストラテジーソースコード
/*backtest
start: 2023-01-15 00:00:00
end: 2024-01-21 00:00:00
period: 1d
basePeriod: 1h
exchanges: [{"eid":"Futures_Binance","currency":"BTC_USDT"}]
*/

// This source code is subject to the terms of the Mozilla Public License 2.0 at https://mozilla.org/MPL/2.0/
// © Ronsword
//@version=5

strategy("bb 2ND target", overlay=true)

// STEP 1. Create inputs that configure the backtest's date range
useDateFilter = input.bool(true, title="Filter Date Range of Backtest",
     group="Backtest Time Period")
backtestStartDate = input(timestamp("1 Jan 1997"),
     title="Start Date", group="Backtest Time Period",
     tooltip="This start date is in the time zone of the exchange " +
     "where the chart's instrument trades. It doesn't use the time " +
     "zone of the chart or of your computer.")
backtestEndDate = input(timestamp("1 Sept 2023"),
     title="End Date", group="Backtest Time Period",
     tooltip="This end date is in the time zone of the exchange " +
     "where the chart's instrument trades. It doesn't use the time " +
     "zone of the chart or of your computer.")

// STEP 2. See if the current bar falls inside the date range
inTradeWindow = true

// Bollinger Bands inputs
length = input.int(20, title="Bollinger Bands Length")
mult = input.float(2.0, title="Multiplier")
src = input(close, title="Source")
basis = ta.sma(src, length)
dev = mult * ta.stdev(src, length)
upper = basis + dev
lower = basis - dev

// EMA Settings
ema20 = ta.ema(close, 20)
plot(ema20, color=color.blue, title="20 EMA")

// Entry condition
longEntryCondition = ta.crossover(close, lower)

// Define stop loss level as the low of the entry bar
var float stopLossPrice = na
if longEntryCondition
    stopLossPrice := low

// Top Bollinger Band itself is set as the target
topBandTarget = upper

// Enter long position when conditions are met
if inTradeWindow and longEntryCondition
    strategy.entry("Long", strategy.long, qty=1)

// Set profit targets
strategy.exit("ProfitTarget2", from_entry="Long", limit=topBandTarget)

// Set stop loss
strategy.exit("StopLoss", stop=stopLossPrice)

// Plot Bollinger Bands with the same gray color
plot(upper, color=color.gray, title="Upper Bollinger Band")
plot(lower, color=color.gray, title="Lower Bollinger Band")