モメンタム指標と恐怖指数のクロスオーバー戦略
作成日:
2024-01-23 14:27:23
最終変更日:
2024-01-23 14:27:23
コピー:
3
クリック数:
665
1
フォロー
1750
フォロワー
概要
この戦略は,動態指数とパニック指数の交差を計算して市場の動きを判断し,二つの指標が特定の交差を発生したとき,売り込みシグナルを発信し,大幅な下落を捕捉する.
戦略原則
- 50サイクル動力の指標を計算する.これは50サイクル前の価格に対する変化を示している.
- 22周期のパニック指数修正値を計算する.これは,最高価格と最低価格の比率によって市場のパニック感情を表す.
- 動態指標が恐慌指数を下回ったとき,市場には下落の圧力があることを示している.
- 動量指数が危険領域に下がり続けると,強いセールシグナルが発せられます.
優位分析
- 市場取引情緒指標であるパニック指数は,市場の構造的変化を効果的に判断することができる.
- 動態指標は,価格の変化の速度と強さを判断し,市場の傾向の変化を判断するのに役立ちます.
- この2つの異なるタイプの指標を組み合わせることで,突発的な出来事をより正確に識別できます.
- パラメータを調整することで,異なる市場環境に柔軟に対応できます.
リスク分析
- パニック指数と動力の指数を交差しても,毎回大幅な下落を保証することはできません.最終的な決定を決定するために,他の指標を統合する必要があります.
- 販売後,ストップ・ロスが設定されず,損失を効果的に制御することができない.
- 逆転と再入場は考慮されていません. 戦略は突然の下落を捕捉するだけのものです.
最適化の方向
- 販売後にストップ・ロスを設定し,損失をコントロールする.
- 他の指標の判断を増やし,信号の信頼性を高めます.例えば,交差量,ブリンラインなどです.
- 長期サイクルで戦略を完全に実行できるように,再入場シグナルを追加します.
- パラメータを最適化して,最適なパラメータの組み合わせを見つけます.
要約する
この戦略は,運動指標とパニック指標の交差によって市場の下落を警告する.それは市場の突然の下落を効果的に捕捉することができる.しかし,この戦略は,短線アプリケーションにのみ適しており,退出機構とリスク管理はありません.将来,それが長線持続可能な戦略になるように,改善を続ける必要があります.
ストラテジーソースコード
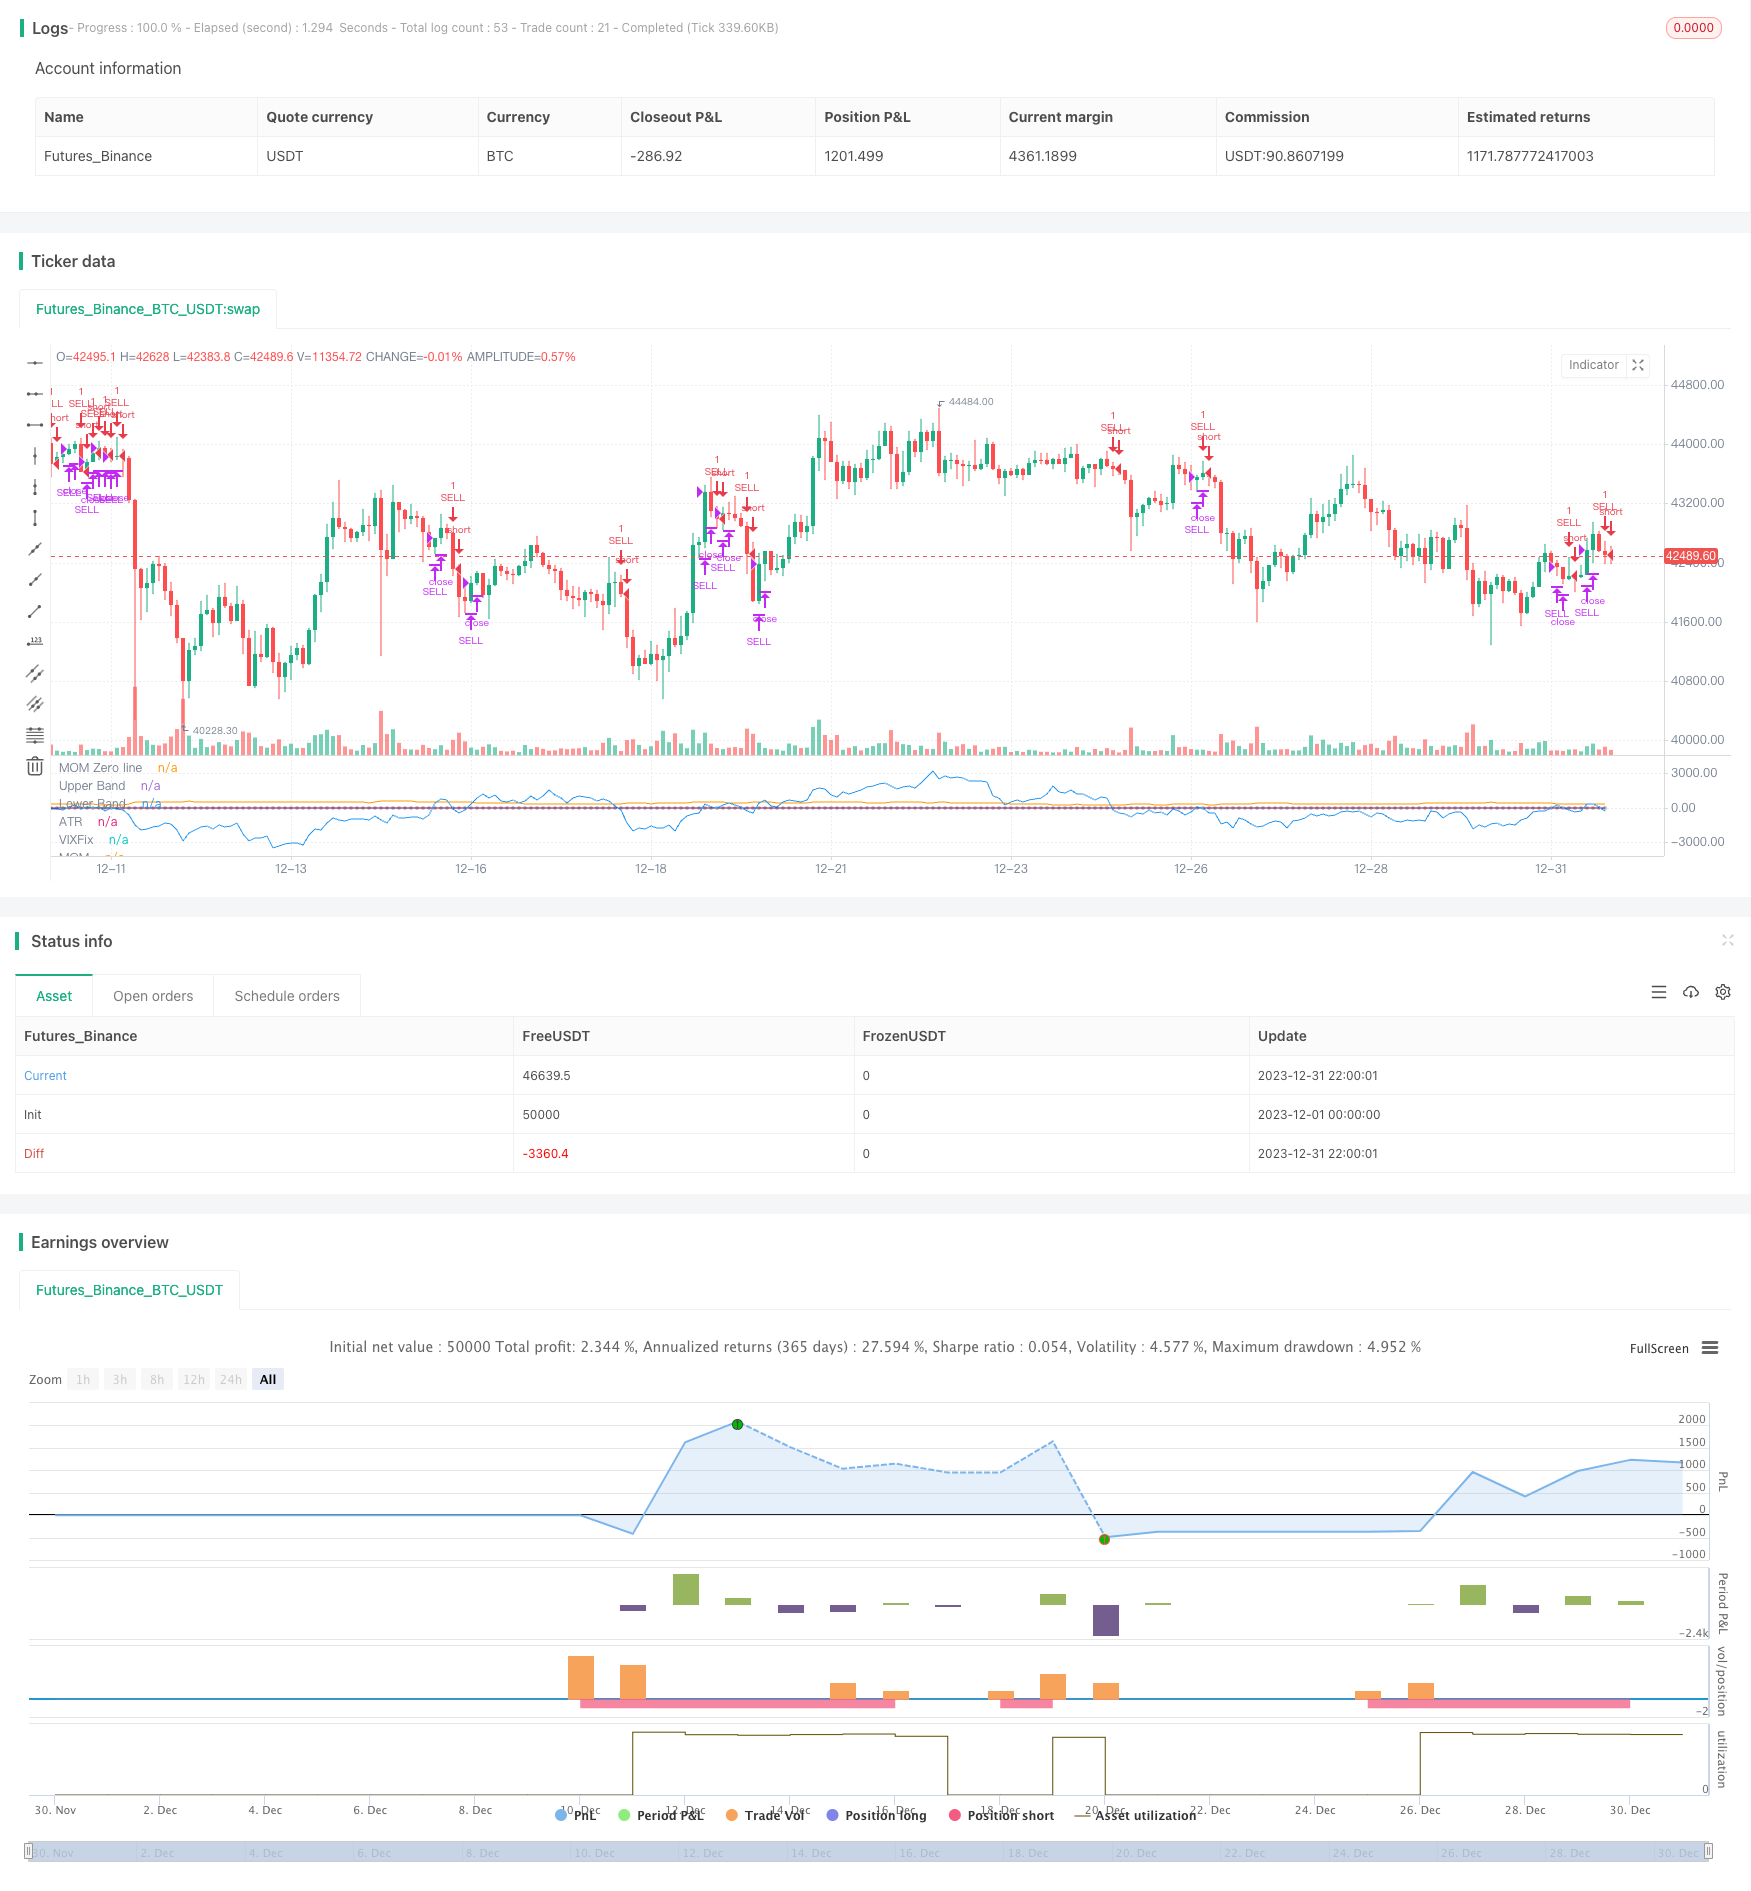
/*backtest
start: 2023-12-01 00:00:00
end: 2023-12-31 23:59:59
period: 2h
basePeriod: 15m
exchanges: [{"eid":"Futures_Binance","currency":"BTC_USDT"}]
*/

// This source code is subject to the terms of the Mozilla Public License 2.0 at https://mozilla.org/MPL/2.0/
// © gary_trades

//THIS SCRIPT HAS BEEN BUIL TO BE USED AS A S&P500 SPY CRASH INDICATOR (should not be used as a strategy).
//THIS SCRIPT HAS BEEN BUILT AS A STRATEGY FOR VISUALIZATION PURPOSES ONLY AND HAS NOT BEEN OPTIMISED FOR PROFIT.
//The script has been built to show as a lower indicator and also gives visual SELL signal on top when conditions are met. BARE IN MIND NO STOP LOSS, NOR ADVANCED EXIT STRATEGY HAS BEEN BUILT.
//As well as the chart SELL signal an alert has also been built into this script.
//The script utilizes a VIX indicator (marron line) and 50 period Momentum (blue line) and Danger/No trade zone(pink shading).
//When the Momentum line crosses down across the VIX this is a sell off but in order to only signal major sell offs the SELL signal only triggers if the momentum continues down through the danger zone.
//To use this indicator to identify ideal buying then you should only buy when Momentum line is crossed above the VIX and the Momentum line is above the Danger Zone.
//This is best used as a daily time frame indicator

//@version=4
strategy(title="S&P Bear Warning", shorttitle="Bear Warning" )

//Momentum
len = input(50, minval=1, title="Length")
src = input(close, title="Source")
bandUpper = input( 5)
bandLower = input(-5)
// ————— Control plotting of each signal. You could use the same technique to be able to turn acc/dist on/off.
showVixFix = input(true)
showMomentum = input(true)

mom = src - src[len]
myAtr = atr(14)
plot(showMomentum ? mom : na, color=color.blue, title="MOM")
plot(showMomentum ? 0 : na, color=color.silver, title="MOM Zero line", style=plot.style_circles, transp=100)
plot(showMomentum ? myAtr : na, color=color.orange, title="ATR", transp=90)

//VIX
VIXFixLength = input(22,title="VIX Fix Length")
VIXFix = (highest(close,VIXFixLength)-low)/(highest(close,VIXFixLength))*100
plot(showVixFix ? VIXFix : na, "VIXFix", color=color.maroon)

band1 = plot(showVixFix ? bandUpper : na, "Upper Band", color.red, 1, plot.style_line, transp=90)
band0 = plot(showVixFix ? bandLower : na, "Lower Band", color.red, 1, plot.style_line, transp=90)
fill(band1, band0, color=color.red, transp=85, title="Background")

//Identify Triggers
//Back Test Range
start = timestamp("America/New_York", 2000, 1, 1, 9,30)
end   = timestamp("America/New_York", 2020, 7, 1, 0, 0)

//Momentum
Long1 = mom > bandUpper
Short1 = mom < bandLower

//VIX
Long2  = crossover(mom, VIXFix)
Short2 = crossunder(mom, VIXFix)

//Warning Alert
SellAlert = Short1
alertcondition(SellAlert, title="Sell SPY", message="Warning Selling off {{ticker}}, price= {{close}}")

//Entry and Exit
if true
    strategy.entry("SELL", false, when = Short1)

strategy.close("SELL", when = Long2)