モメンタムベースのリトレースメント戦略
作成日:
2024-01-23 15:23:14
最終変更日:
2024-01-23 15:23:14
コピー:
2
クリック数:
659
1
フォロー
1750
フォロワー
概要
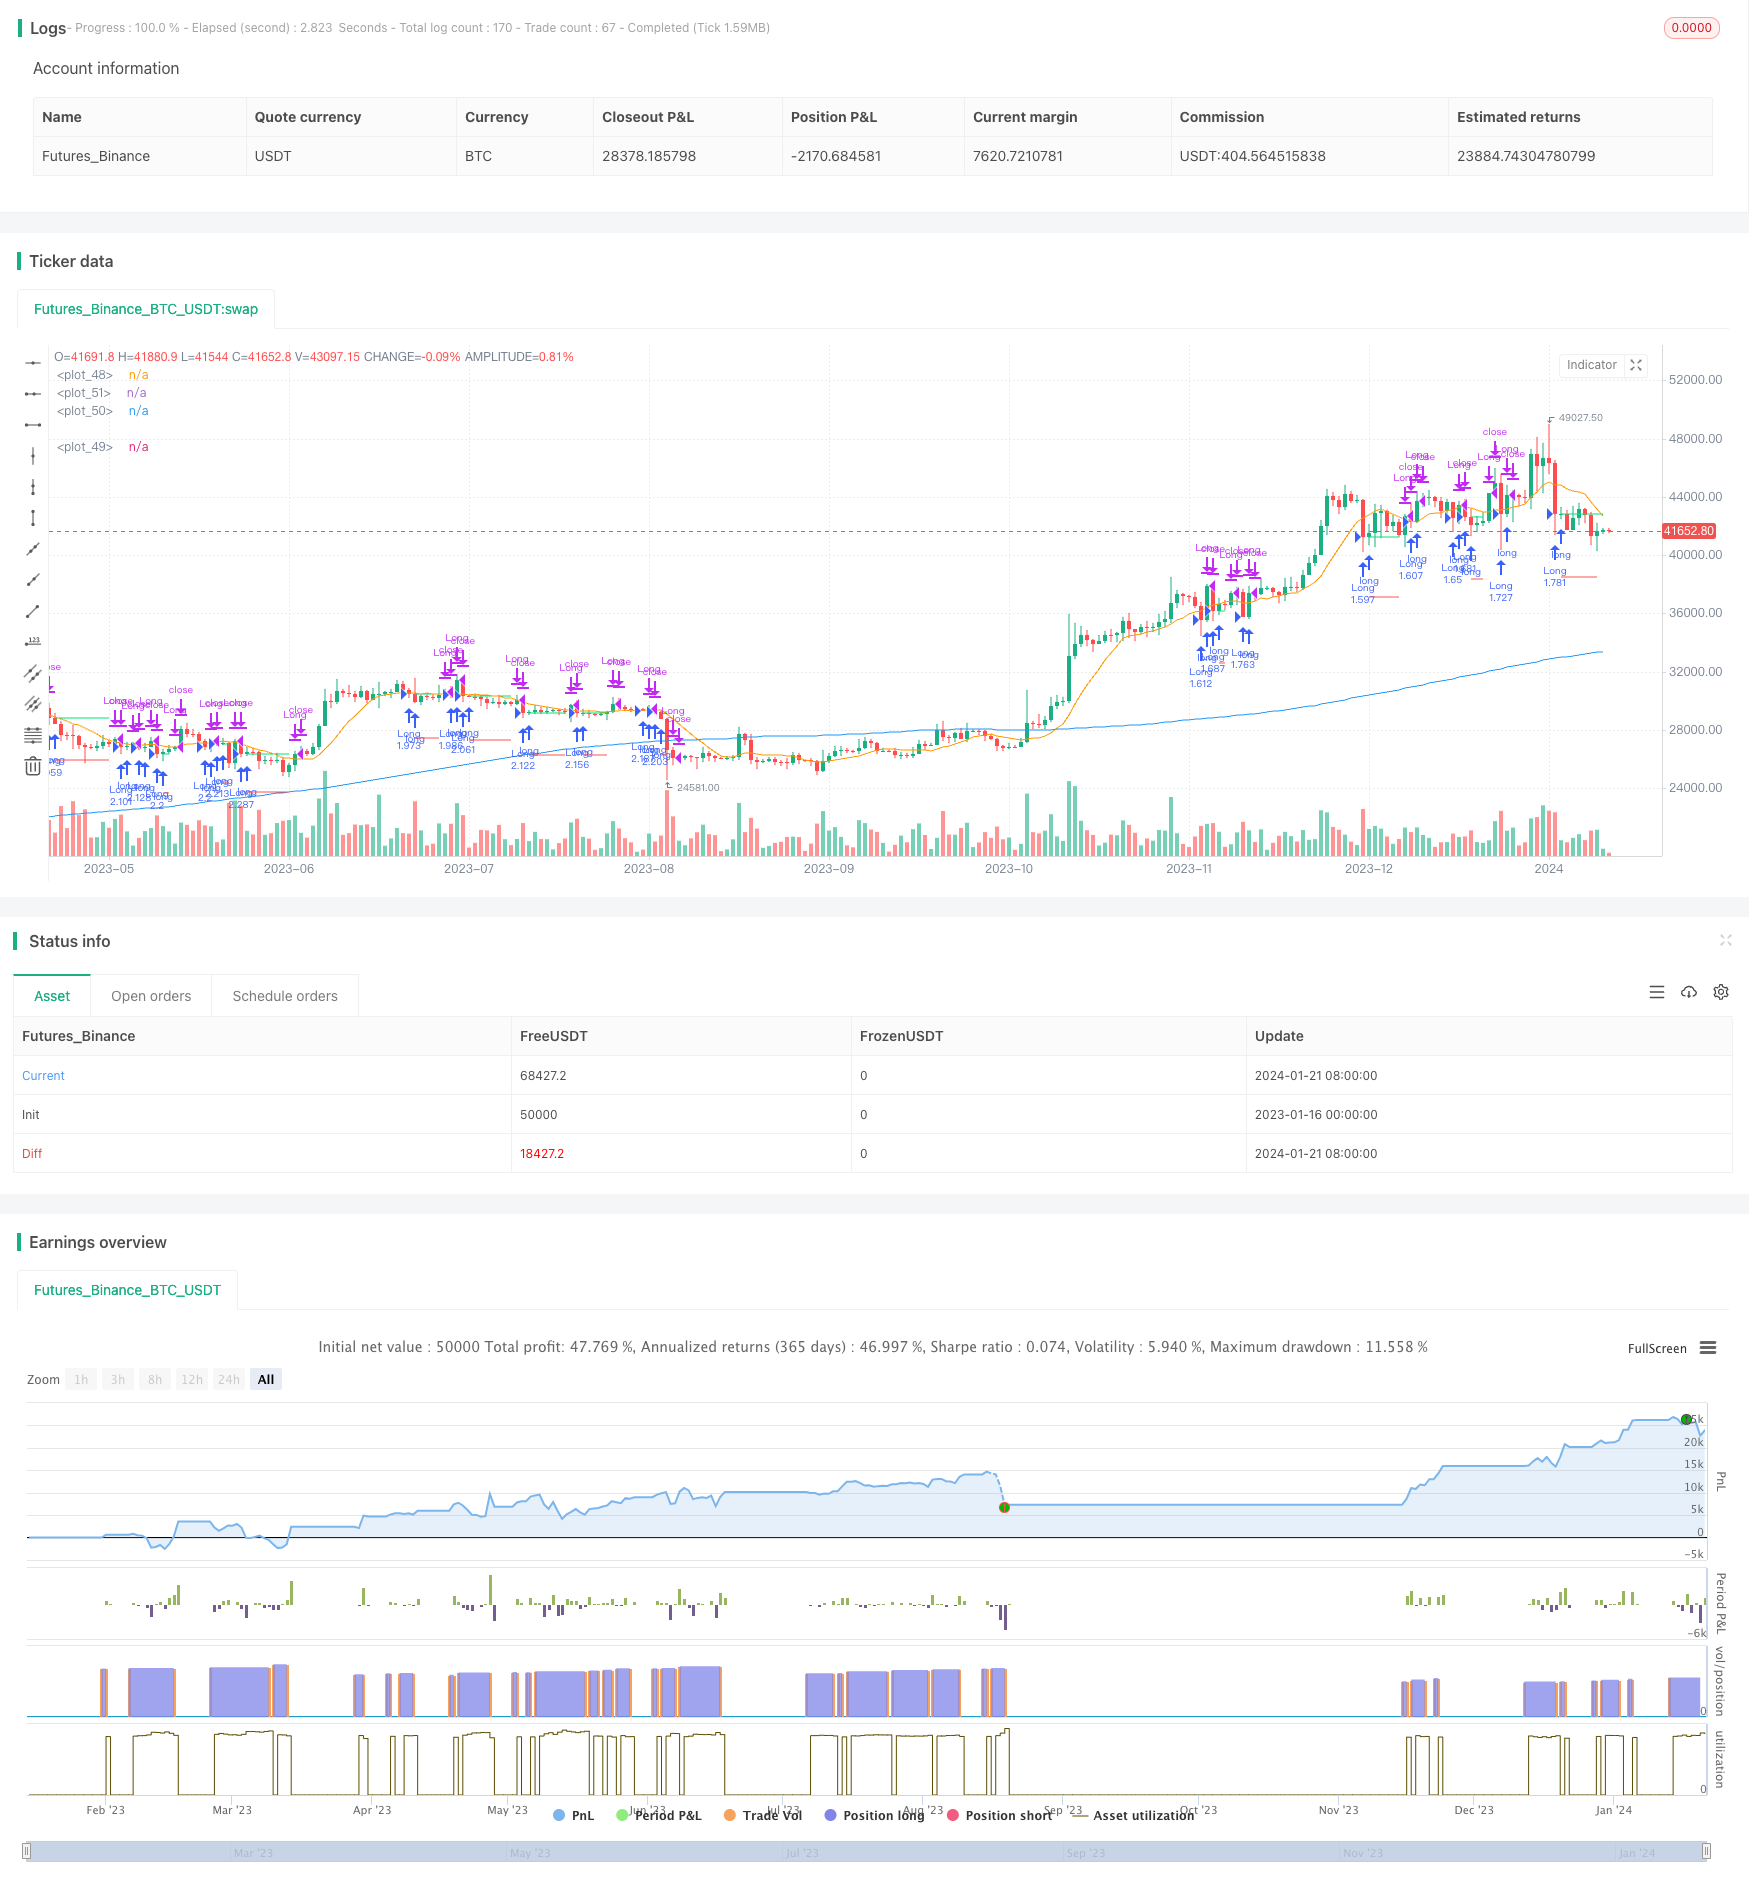
この戦略は,市場における潜在的逆転の機会を識別することを目的としている.この戦略は,長期移動平均 ((MA1) と短期移動平均 ((MA2)) の二均線システムを採用している.主な目的は,收盤価格がMA1より低いがMA2より高いときに,大きなトレンドの潜在的逆転の機会を示し,それにより多額の取引を行うことである.
戦略原則
この戦略は,2つの移動平均線を使用します:MA1 (長線) とMA2 (短線). その原理は,短期価格が逆転して長期トレンドのサポートをテストした場合,これは多額のチャンスである可能性があります.具体的には,閉盘価格が長期サポートより高い場合,MA1は,大トレンドがまだ良いことを示しています.
優位分析
この戦略の利点は以下の通りです.
- シンプルで分かりやすい,パラメータ調整の柔軟性
- 逆行取引を避けるために,大トレンドを識別する双均線システム
- 特定の時間帯の市場異常を回避するカスタマイズ可能な時間フィルター
- ポジションの大きさは,異なるリスクの好みに合わせて調整できます.
- 損失を抑えるために ストップ・メカニズムを導入
リスク分析
この戦略には以下のリスクもあります.
- 価格が下がり続け,損が止まらない
- 支持率の逆転が起こりました.
- 市場が急激に波動し,移動平均は逆転した.
- 取引の機会を逃した
関連して,以下のような面で改善や最適化が可能です.
- 移動平均のパラメータを最適化し,取引信号の質を向上させる
- リスクの最小化で利益を得るために,ストップ・ロスを最適化
- タイムフィルターを調整し,最適な取引時間に設定します.
- 様々な品種と市場環境のテスト
最適化の方向
この戦略は以下の点で最適化できます.
- 移動平均のパラメータを最適化して,最適なパラメータの組み合わせを探します.
- 追跡停止,振動停止などの様々な停止メカニズムをテストする
- 取引量フィルター,変動率フィルターなどのフィルターを追加します.
- 金叉加仓,死叉減仓などのポジション管理メカニズムを増やす
- 自動停止装置が追加された
- テストを行い,重要な指標を計算し,最適なパラメータを決定します.
要約する
この戦略は,全体として,シンプルで実用的なショートライン引き戻し戦略である.それは,双均線を使用して,反発の機会を識別し,移動停止を設定してリスクを制御する.この戦略は,容易に理解し,実行し,パラメータを調整する柔軟性があり,異なるリスクの好みを満たすことができる.次のステップは,移動平均パラメータ,停止機構,フィルターなどの最適化など,複数の角度から改善され,戦略をより堅牢にすることができる.
ストラテジーソースコード
/*backtest
start: 2023-01-16 00:00:00
end: 2024-01-22 00:00:00
period: 1d
basePeriod: 1h
exchanges: [{"eid":"Futures_Binance","currency":"BTC_USDT"}]
*/

// This source code is subject to the terms of the Mozilla Public License 2.0 at https://mozilla.org/MPL/2.0/
// © ZenAndTheArtOfTrading / www.PineScriptMastery.com
// @version=5
strategy("Simple Pullback Strategy",
     overlay=true,
     initial_capital=50000,
     default_qty_type=strategy.percent_of_equity,
     default_qty_value=100, // 100% of balance invested on each trade
     commission_type=strategy.commission.cash_per_contract,
     commission_value=0.005) // Interactive Brokers rate

// Get user input
i_ma1           = input.int(title="MA 1 Length", defval=200, step=10, group="Strategy Parameters", tooltip="Long-term MA")
i_ma2           = input.int(title="MA 2 Length", defval=10, step=10, group="Strategy Parameters", tooltip="Short-term MA")
i_stopPercent   = input.float(title="Stop Loss Percent", defval=0.10, step=0.1, group="Strategy Parameters", tooltip="Failsafe Stop Loss Percent Decline")
i_lowerClose    = input.bool(title="Exit On Lower Close", defval=false, group="Strategy Parameters", tooltip="Wait for a lower-close before exiting above MA2")
i_startTime     = input(title="Start Filter", defval=timestamp("01 Jan 1995 13:30 +0000"), group="Time Filter", tooltip="Start date & time to begin searching for setups")
i_endTime       = input(title="End Filter", defval=timestamp("1 Jan 2099 19:30 +0000"), group="Time Filter", tooltip="End date & time to stop searching for setups")

// Get indicator values
ma1 = ta.sma(close, i_ma1)
ma2 = ta.sma(close, i_ma2)

// Check filter(s)
f_dateFilter =true

// Check buy/sell conditions
var float buyPrice = 0
buyCondition    = close > ma1 and close < ma2 and strategy.position_size == 0 and f_dateFilter
sellCondition   = close > ma2 and strategy.position_size > 0 and (not i_lowerClose or close < low[1])
stopDistance    = strategy.position_size > 0 ? ((buyPrice - close) / close) : na
stopPrice       = strategy.position_size > 0 ? buyPrice - (buyPrice * i_stopPercent) : na
stopCondition   = strategy.position_size > 0 and stopDistance > i_stopPercent

// Enter positions
if buyCondition
    strategy.entry(id="Long", direction=strategy.long)

if buyCondition[1]
    buyPrice := open

// Exit positions
if sellCondition or stopCondition
    strategy.close(id="Long", comment="Exit" + (stopCondition ? "SL=true" : ""))
    buyPrice := na

// Draw pretty colors
plot(buyPrice, color=color.lime, style=plot.style_linebr)
plot(stopPrice, color=color.red, style=plot.style_linebr, offset=-1)
plot(ma1, color=color.blue)
plot(ma2, color=color.orange)