トレンドフォローのストップロスとテイクプロフィット戦略
作成日:
2024-01-24 14:17:28
最終変更日:
2024-01-24 14:17:28
コピー:
1
クリック数:
828
1
フォロー
1750
フォロワー
概要
これは,ブリン帯指数に基づいてトレンドを判断し,ATR指数を使用してストップストロップを設定するトレンド追跡戦略である.この戦略は,IRONMENTラインで市場トレンドを判断し,平仓時にストップストロップを設定する.
戦略原則
- ブリン帯の上下線を計算する.
- 閉店価格が上線より高いか下線より低いかを判断し,そうであればトレンド市場,多頭市場,空頭市場と判断する.
- トレンドマーケットの場合,環境線を計算する.環境線は,最低価格減算ATRの値 ((多頭市場) または最高価格加算ATRの値 ((空頭市場)) による.
- トレンド市場でない場合,環境線は前K線と同じ環境線値を維持する.
- ENVIRONMENT線を比較して,トレンドの方向を判断する. 上昇が多頭,下降が空頭である.
- ENVIRONMENT線が方向転換すると,買/売信号が生成されます.
- セットストップ・ストップ:固定ストップ距離は入場価格の100倍;浮動ストップ距離は入場価格の1.1倍 (多頭) または0.9倍 (空頭) である.
優位分析
- 市場動向を判断し,偽の突破操作を減らすことができます.
- ENVIRONMENTのラインを設定して,入らないようにしてください.
- ストップ・ストップの設定は合理的で,収益を保証しながらリスクを制御できます.
リスク分析
- パラメータの設定を間違えた場合,取引の機会を逃す可能性があります.
- ブリン帯は震災時に判断を誤る可能性が高い.
- ストップダメージポイントが近すぎると,セカンドが出場する可能性があります.
最適化の方向
- ブリン帯のパラメータを最適化して,異なる品種に適したものにしました.
- ENVIRONMENTラインの計算方法の最適化,例えば他の指標の導入など.
- テストし,止損ブレーキのパラメータ設定を最適化する.
要約する
これは,ブリン帯判断トレンドを利用してENVIRONMENT線を設定し,ストップ・ストップを設定する戦略である.核心的な優位性は,トレンド判断が明確で,ストップ・ストップの設定が合理的で,リスクを効果的にコントロールできるものである.主なリスクは,ブリン帯傾向判断の誤りとストップ・ポイントが近すぎることにある.将来の最適化方向は,パラメータ最適化,ENVIRONMENT線計算方法最適化,ストップ・ストップ最適化などである.
ストラテジーソースコード
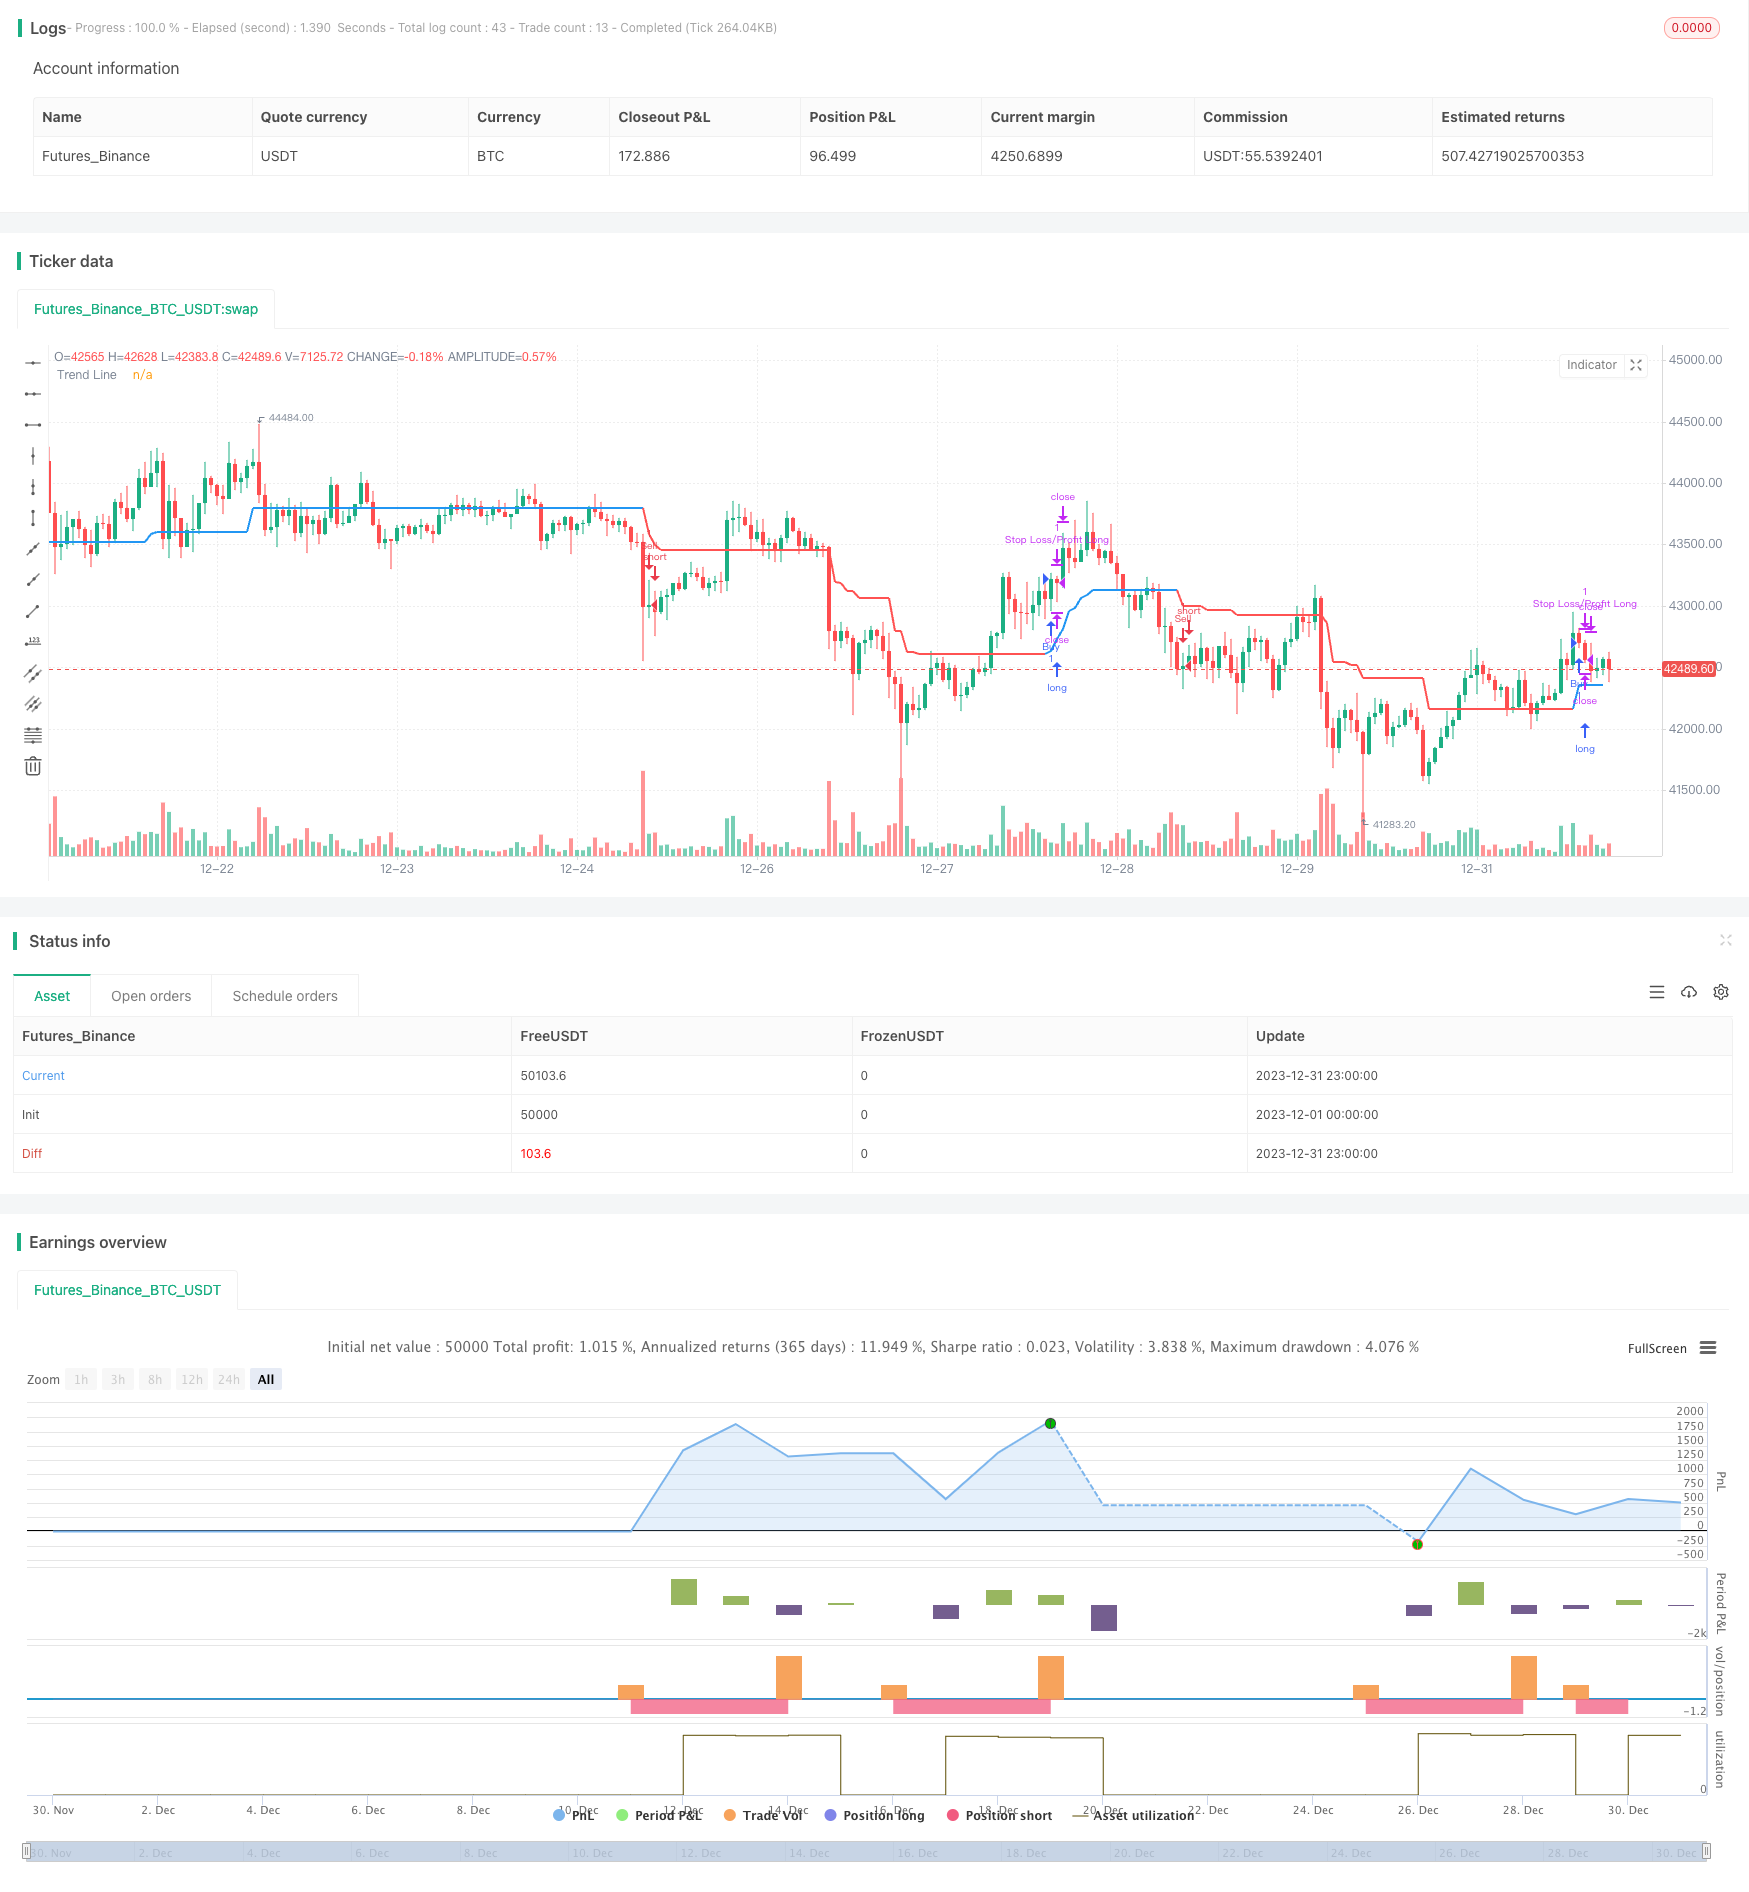
/*backtest
start: 2023-12-01 00:00:00
end: 2023-12-31 23:59:59
period: 1h
basePeriod: 15m
exchanges: [{"eid":"Futures_Binance","currency":"BTC_USDT"}]
*/

// This Pine Script™ code is subject to the terms of the Mozilla Public License 2.0 at https://mozilla.org/MPL/2.0/
// © zhuenrong

// © Dreadblitz
//@version=4
strategy(shorttitle="FLI", title="Follow Line Indicator", overlay=true)
//
BBperiod      = input(defval = 21,     title = "BB Period",    type = input.integer, minval = 1)
BBdeviations  = input(defval = 1.00,     title = "BB Deviations",    type = input.float, minval = 0.1, step=0.05)
UseATRfilter  = input(defval = true, title = "ATR Filter",  type = input.bool)
ATRperiod     = input(defval = 5,     title = "ATR Period",    type = input.integer, minval = 1)
hl            = input(defval = false, title = "Hide Labels",  type = input.bool)
//
BBUpper=sma (close,BBperiod)+stdev(close, BBperiod)*BBdeviations
BBLower=sma (close,BBperiod)-stdev(close, BBperiod)*BBdeviations
//
TrendLine = 0.0
iTrend = 0.0
buy = 0.0
sell = 0.0
//
BBSignal = close>BBUpper? 1 : close<BBLower? -1 : 0
//
if BBSignal == 1 and UseATRfilter == 1
    TrendLine:=low-atr(ATRperiod)
    if TrendLine<TrendLine[1]
        TrendLine:=TrendLine[1]
if BBSignal == -1 and UseATRfilter == 1
    TrendLine:=high+atr(ATRperiod)
    if TrendLine>TrendLine[1]
        TrendLine:=TrendLine[1]
if BBSignal == 0 and UseATRfilter == 1
    TrendLine:=TrendLine[1]
//
if BBSignal == 1 and UseATRfilter == 0
    TrendLine:=low
    if TrendLine<TrendLine[1]
        TrendLine:=TrendLine[1]
if BBSignal == -1 and UseATRfilter == 0
    TrendLine:=high
    if TrendLine>TrendLine[1]
        TrendLine:=TrendLine[1]
if BBSignal == 0 and UseATRfilter == 0
    TrendLine:=TrendLine[1]
//
iTrend:=iTrend[1]
if TrendLine>TrendLine[1]
    iTrend:=1
if TrendLine<TrendLine[1]
    iTrend:=-1
//
buy:=iTrend[1]==-1 and iTrend==1 ? 1 : na
sell:=iTrend[1]==1 and iTrend==-1? 1 : na
//
plot(TrendLine, color=iTrend > 0?color.blue:color.red ,style=plot.style_line,linewidth=2,transp=0,title="Trend Line")
plotshape(buy == 1 and hl == false? TrendLine-atr(8) :na, text='💣', style= shape.labelup, location=location.absolute, color=color.blue, textcolor=color.white, offset=0, transp=0,size=size.auto)
plotshape(sell == 1 and hl == false ?TrendLine+atr(8):na, text='🔨', style=shape.labeldown, location=location.absolute, color=color.red, textcolor=color.white, offset=0, transp=0,size=size.auto)
//
alertcondition(sell == 1 ,title="Sell",message="Sell")
alertcondition(buy == 1 ,title="Buy",message="Buy")
alertcondition(buy == 1 or sell == 1 ,title="Buy/Sell",message="Buy/Sell")
if (buy==1)
    strategy.entry("Buy", strategy.long)
if (sell==1)
    strategy.entry("Sell", strategy.short)
// === Stop LOSS ===

if strategy.position_size>0
    strategy.exit("Stop Loss/Profit Long","Buy", stop=strategy.position_avg_price*100, limit=strategy.position_avg_price*1.1)
if strategy.position_size<0
    strategy.exit("Stop Loss/Profit Short","Sell", stop=strategy.position_avg_price*100, limit=strategy.position_avg_price*0.9)