動的位置調整トレンド追跡システム
概要
この戦略は,指数移動平均線交差システムと海取引システムの2つの一般的なシステム取引戦略を統合した.このシステムは日経時間枠に専用され,ポジションを動的に調整し,市場動向をリアルタイムで追跡し,強力な追跡能力を持っています.
戦略原則
この戦略は,トレンド戦略とブレイク戦略の2つの子戦略で構成されています.
トレンド戦略は,高速EMAと遅いEMAの交差を取引信号として使用する.高速EMAの周期長さは,ユーザによって設定され,遅いEMAの周期長さは,高速EMAの5倍である.信号は,高速EMAの差値を252周期リターンレートの標準差で割ることで得られ,波動率の調整後により信頼性の高い取引信号を生成する.新しいトレンドの形成が検出されたとき,多行または空行する.
突破策は,固定周期の最高値と最低値の平均値を基準線として使用する. 価格が相対的に基準線に上り,下り,一定の幅を超えると,多価または空調の信号を生成する.
ポジション調整は,最近の価格変動とユーザーによって設定された年次リスク目標に基づいて計算されます. 波動性が低い時はポジションが大きい,波動性が大きい時はポジションが小さい,リスク調整後のダイナミックなポジション管理を実現します.
ストップダメージは実際の波幅の倍数で設定されている.ストップダメージは最高値と最低値の移動回収を追跡している.
優位分析
この戦略の利点は以下の通りです.
トレンド追跡と突破の2つの子戦略を組み合わせて,異なる市場環境で適応的な切り替えを行うことができ,強烈な性を持つ.
高度なポジション管理とリスク管理技術を適用し,ポジションを動的に調整し,リスクを効果的に制御する.
実在の変動と年金化リスク目標を活用してポジションを調整することで,高低変動の市場で比較的安定したポートフォリオリスクレベルを得ることができる.
価格の実際の変動に基づいてストップ・ポジションを設定することで,ストップ・フィールドから不必要な小損失を効果的に回避できます.
リアルタイムでストップポジションを調整し,トレンドを柔軟に追跡して,タイムリーでストップをオフにすることができます.
リスク分析
この戦略の主なリスクは,
異なるパラメータが戦略のパフォーマンスに大きく影響するパラメータの最適化に依存し,最適なパラメータを得るためには,全面的なテストが必要である.
ストップを追跡する ストップは,震動のトレンドの中であまりにも頻繁にストップするかもしれない. ストップの幅を適切に緩め,ストップメカニズムを最適化することができます.
ポジション管理とリスク管理技術は,初期資金と取引コストに敏感である.初期資金が過小で取引コストが過高である場合,戦略の収益性に影響を与える.
策略の年率リスク目標と最大レバレッジの設定は,正しく評価された指標の波動性に依存する.波動性の評価が不正確である場合,ポジションが偏大または偏小になる可能性があります.
最適化の方向
戦略の主要な最適化方向は以下の通りです.
最適なパラメータの組み合わせを探す.より多くの歴史的データによる反省により,最適なパラメータの設定を見つけることができる.
止損機構の改善 移動止損,時間止損,震動止損などの止損形式をテストし,止損戦略を最適化できる
ポジションとリスク管理を最適化します.最適なリスク/リターン・ポートフォリオを見つけるために,異なるリスク目標をテストできます.また,異なるレバレッジレベルの影響をテストできます.
他の補助指標を試す. 信号の正確性と戦略の安定性を高めるために,より多くの技術指標を追加することができます.
異なるポジション周期をテストする.より高い周期の補助意思決定を利用して,ポジション配置の正確性を向上させることができる.
要約する
この戦略は,トレンド追跡とトレンドを突破する2つのカテゴリーの取引戦略を統合し,高度なダイナミックポジション管理技術を適用し,リスク調整後のポジション配置を実現し,リスクを効果的に制御し,市場動向を効果的に追跡し,収益性が強く,さらなるテストと最適化の価値があります.
/*backtest
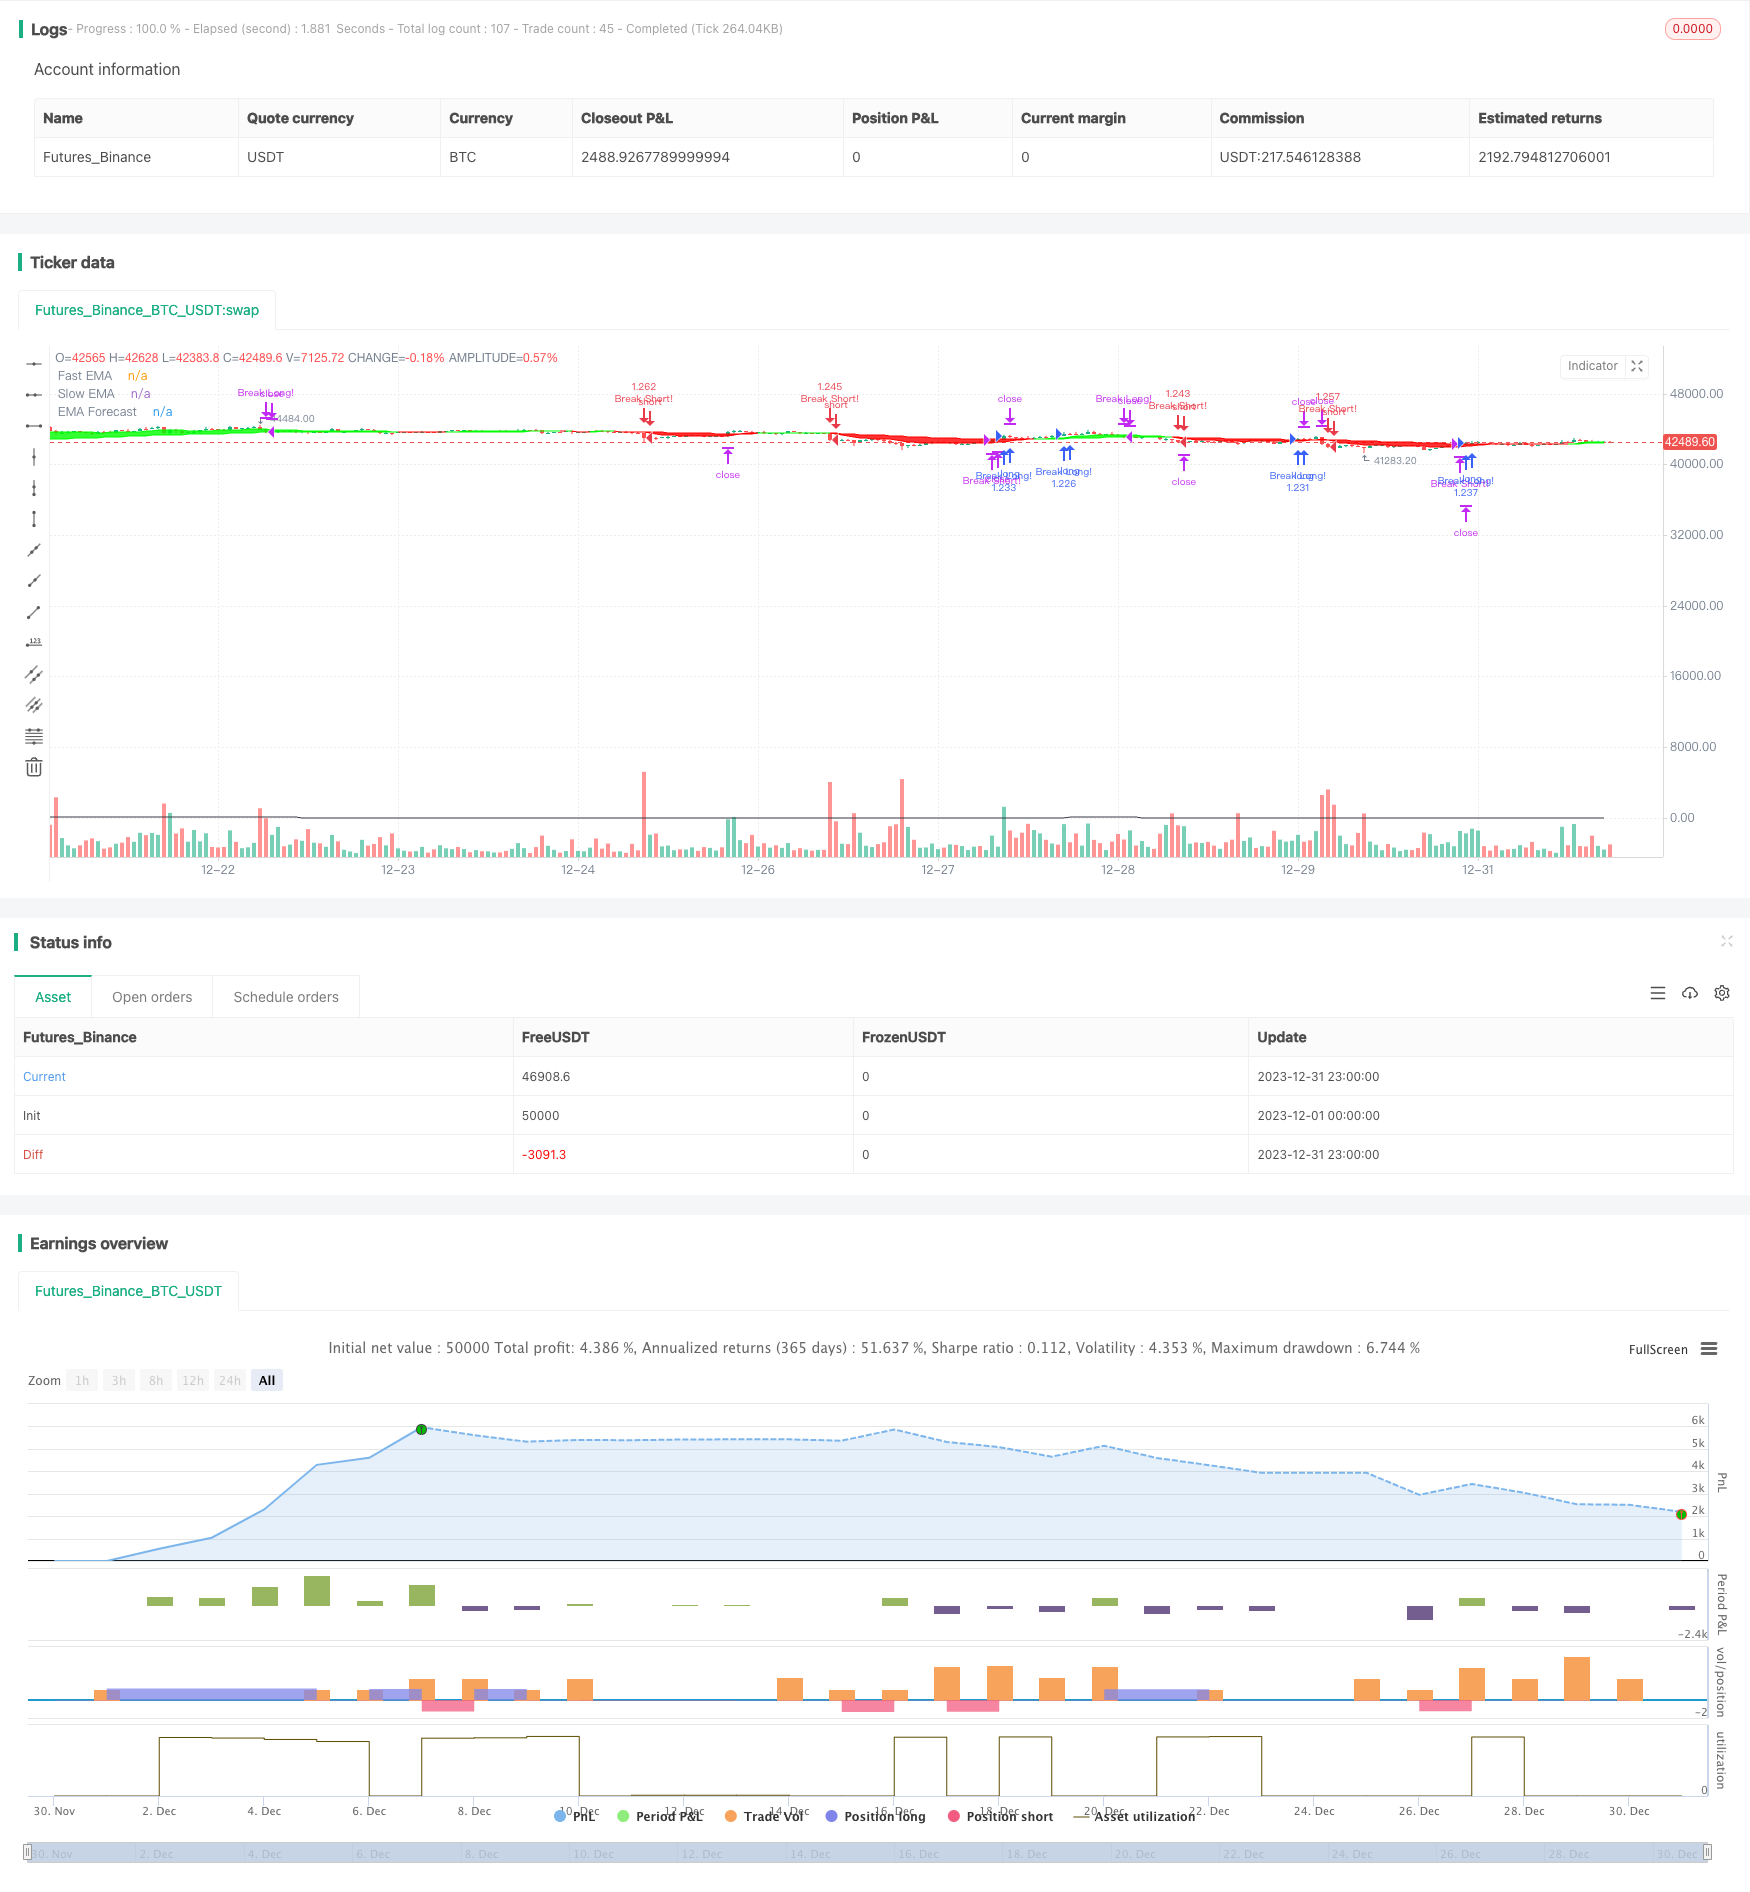
start: 2023-12-01 00:00:00
end: 2023-12-31 23:59:59
period: 1h
basePeriod: 15m
exchanges: [{"eid":"Futures_Binance","currency":"BTC_USDT"}]
*/
// This source code is subject to the terms of the Mozilla Public License 2.0 at https://mozilla.org/MPL/2.0/
// © Crunchster1
//@version=5
strategy(title="Crunchster's Turtle and Trend System", shorttitle="Turtle Trend", overlay=true, slippage=10, pyramiding=1, precision = 4, calc_on_order_fills = false, calc_on_every_tick = false, default_qty_value = 0.1, initial_capital = 1000, commission_value = 0.06, process_orders_on_close = true)
// Inputs and Parameters
src = input(close, 'Source', group='Strategy Settings')
length = input.int(title="Lookback period for fast EMA", defval=10, minval=2, group='Strategy Settings', tooltip='This sets the lookback period for the fast exponential moving average. The slow EMA is 5x the fast EMA length')
blength = input.int(title="Lookback period for Breakout", defval=20, minval=5, step=5, group='Strategy Settings')
long = input(true, 'Long', inline='08', group='Strategy toggle')
short = input(true, 'Short', inline='08', group='Strategy toggle', tooltip='Toggle long/short strategy on/off')
EMAwt = input(false, 'Trend', inline='01', group='Strategy toggle')
breakwt = input(true, 'Breakout', inline='01', group='Strategy toggle', tooltip='Toggle trend/breakout strategy on/off')
stopMultiple = input.float(2, 'Stop multiple', step=0.5, group='Risk Management Settings', tooltip='Multiple for ATR, setting hard stop loss from entry price')
trail = input.int(10, 'Trail lookback', step=5, group='Risk Management Settings', tooltip='Lookback period for the trailing stop')
lev = input.float(1, 'Max Leverage', step=0.5, group='Risk Management Settings', tooltip='Max leverage sets maximum allowable leverage of total capital (initial capital + any net profit), capping maximum volatility adjusted position size')
riskT = input.float(15, maxval=75, title='Annualised Volatility Target %', group='Risk Management Settings', tooltip='Specify annual risk target, used to determine volatility adjusted position size. Annualised daily volatility is referenced to this value and position size adjusted accordingly')
comp = input(true, 'Compounding', inline='09', group='Risk Management Settings')
Comppct = input.float(50, '%', step=5, inline='09', group='Risk Management Settings', tooltip='Toggle compounding of profit, and set % of profit to compound')
// Backtesting period
FromDay = input.int(defval=1, title='From Day', minval=1, maxval=31, inline='04', group='Backtest range')
FromMonth = input.int(defval=1, title='From Mon', minval=1, maxval=12, inline='04', group='Backtest range')
FromYear = input.int(defval=2018, title='From Yr', minval=1900, inline='04', group='Backtest range', tooltip='Set start of backtesting period')
ToDay = input.int(defval=1, title='To Day', minval=1, maxval=31, inline='05', group='Backtest range')
ToMonth = input.int(defval=1, title='To Mon', minval=1, maxval=12, inline='05', group='Backtest range')
ToYear = input.int(defval=9999, title='To Yr', minval=1900, inline='05', group='Backtest range', tooltip='Set end of backtesting period')
start = timestamp(FromYear, FromMonth, FromDay, 00, 00)
finish = timestamp(ToYear, ToMonth, ToDay, 23, 59)
window = time >= start and time <= finish
// Breakout strategy
lower = ta.lowest(low[1], blength)
upper = ta.highest(high[1], blength)
basis = math.avg(upper, lower)
signal = 20*(close - basis) / (upper - lower)
// Trend strategy
fEMA = ta.ema(close[1], length)
sEMA = ta.ema(close[1], length*5)
emadiff = fEMA - sEMA
nemadiff = 5*emadiff/(ta.stdev(close - close[1], 252))
//Risk Management formulae
strategy.initial_capital = 50000
tr = math.max(high - low, math.abs(high - close), math.abs(low - close)) //True range
stopL = ta.sma(tr, 14) //Average true range
stdev = ta.stdev(close-close[1], 14) //volatility of recent returns
maxcapital = strategy.initial_capital+strategy.netprofit //Maximum capital available to invest - initial capital net of profit
annvol = 100*math.sqrt(365)*stdev/close //converts recent volatility of returns into annualised volatility of returns - assumes daily timeframe
risk = 1.1
if comp
risk := (strategy.initial_capital+(Comppct*strategy.netprofit/100))//adjust investment capital to include compounding
else
risk := strategy.initial_capital
shares = (risk * (riskT/annvol)) / close //calculates volatility adjusted position size, dependent on user specified annualised risk target
if ((shares*close) > lev*maxcapital) //ensures position size does not exceed available capital multiplied by user specified maximum leverage
shares := lev*maxcapital/close
//To set the price at the entry point of trade
Posopen() =>
math.abs(strategy.position_size[1]) <= 0 and math.abs(strategy.position_size) > 0
var float openN = na
if Posopen()
openN := stopL
// Trailing stop
tlower = ta.lowest(low[1], trail)
tupper = ta.highest(high[1], trail)
tbasis = math.avg(tupper, tlower)
tsignal = 20*(close - tbasis) / (tupper - tlower)
// Strategy Rules
if EMAwt
if long
longCondition2 = (nemadiff >2 and nemadiff[1] <2) and window
exitlong = tsignal <= -10
if (longCondition2)
strategy.entry('Trend Long!', strategy.long, qty=shares)
if strategy.position_size > 0
strategy.exit('Stop Long', from_entry = 'Trend Long!', stop=(strategy.opentrades.entry_price(0) - (openN * stopMultiple)))
if (exitlong)
strategy.close('Trend Long!', immediately = true)
if short
shortCondition2 = (nemadiff <-1 and nemadiff[1] >-1) and window
exitshort = tsignal >= 10
if (shortCondition2)
strategy.entry('Trend Short!', strategy.short, qty=shares)
if strategy.position_size < 0
strategy.exit('Stop Short', from_entry = 'Trend Short!', stop=(strategy.opentrades.entry_price(0) + (openN * stopMultiple)))
if (exitshort)
strategy.close('Trend Short!', immediately = true)
if breakwt
if long
longCondition1 = (signal >= 10) and window
exitlong = tsignal <= -10
if (longCondition1)
strategy.entry('Break Long!', strategy.long, qty=shares)
if strategy.position_size > 0
strategy.exit('Stop Long', from_entry = 'Break Long!', stop=(strategy.opentrades.entry_price(0) - (openN * stopMultiple)))
if (exitlong)
strategy.close('Break Long!', immediately = true)
if short
shortCondition1 = (signal <= -10) and window
exitshort = tsignal >= 10
if (shortCondition1)
strategy.entry('Break Short!', strategy.short, qty=shares)
if strategy.position_size < 0
strategy.exit('Stop Short', from_entry = 'Break Short!', stop=(strategy.opentrades.entry_price(0) + (openN * stopMultiple)))
if (exitshort)
strategy.close('Break Short!', immediately = true)
// Visuals of trend and direction
plot(nemadiff, title='EMA Forecast', color=color.black, display=display.none)
plot(ta.sma(ta.median(math.sqrt(math.pow(nemadiff,2)), 700), 350), 'Forecast mean', color=color.rgb(245, 0, 0), display=display.none)
MAColor = fEMA > sEMA ? #00ff00 : #ff0000
MA1 = plot(fEMA, title='Fast EMA', color=MAColor)
MA2 = plot(sEMA, title='Slow EMA', color=MAColor)
fill(MA1, MA2, title='Band Filler', color=MAColor)