デュアル移動平均トレンドフォロー戦略
概要
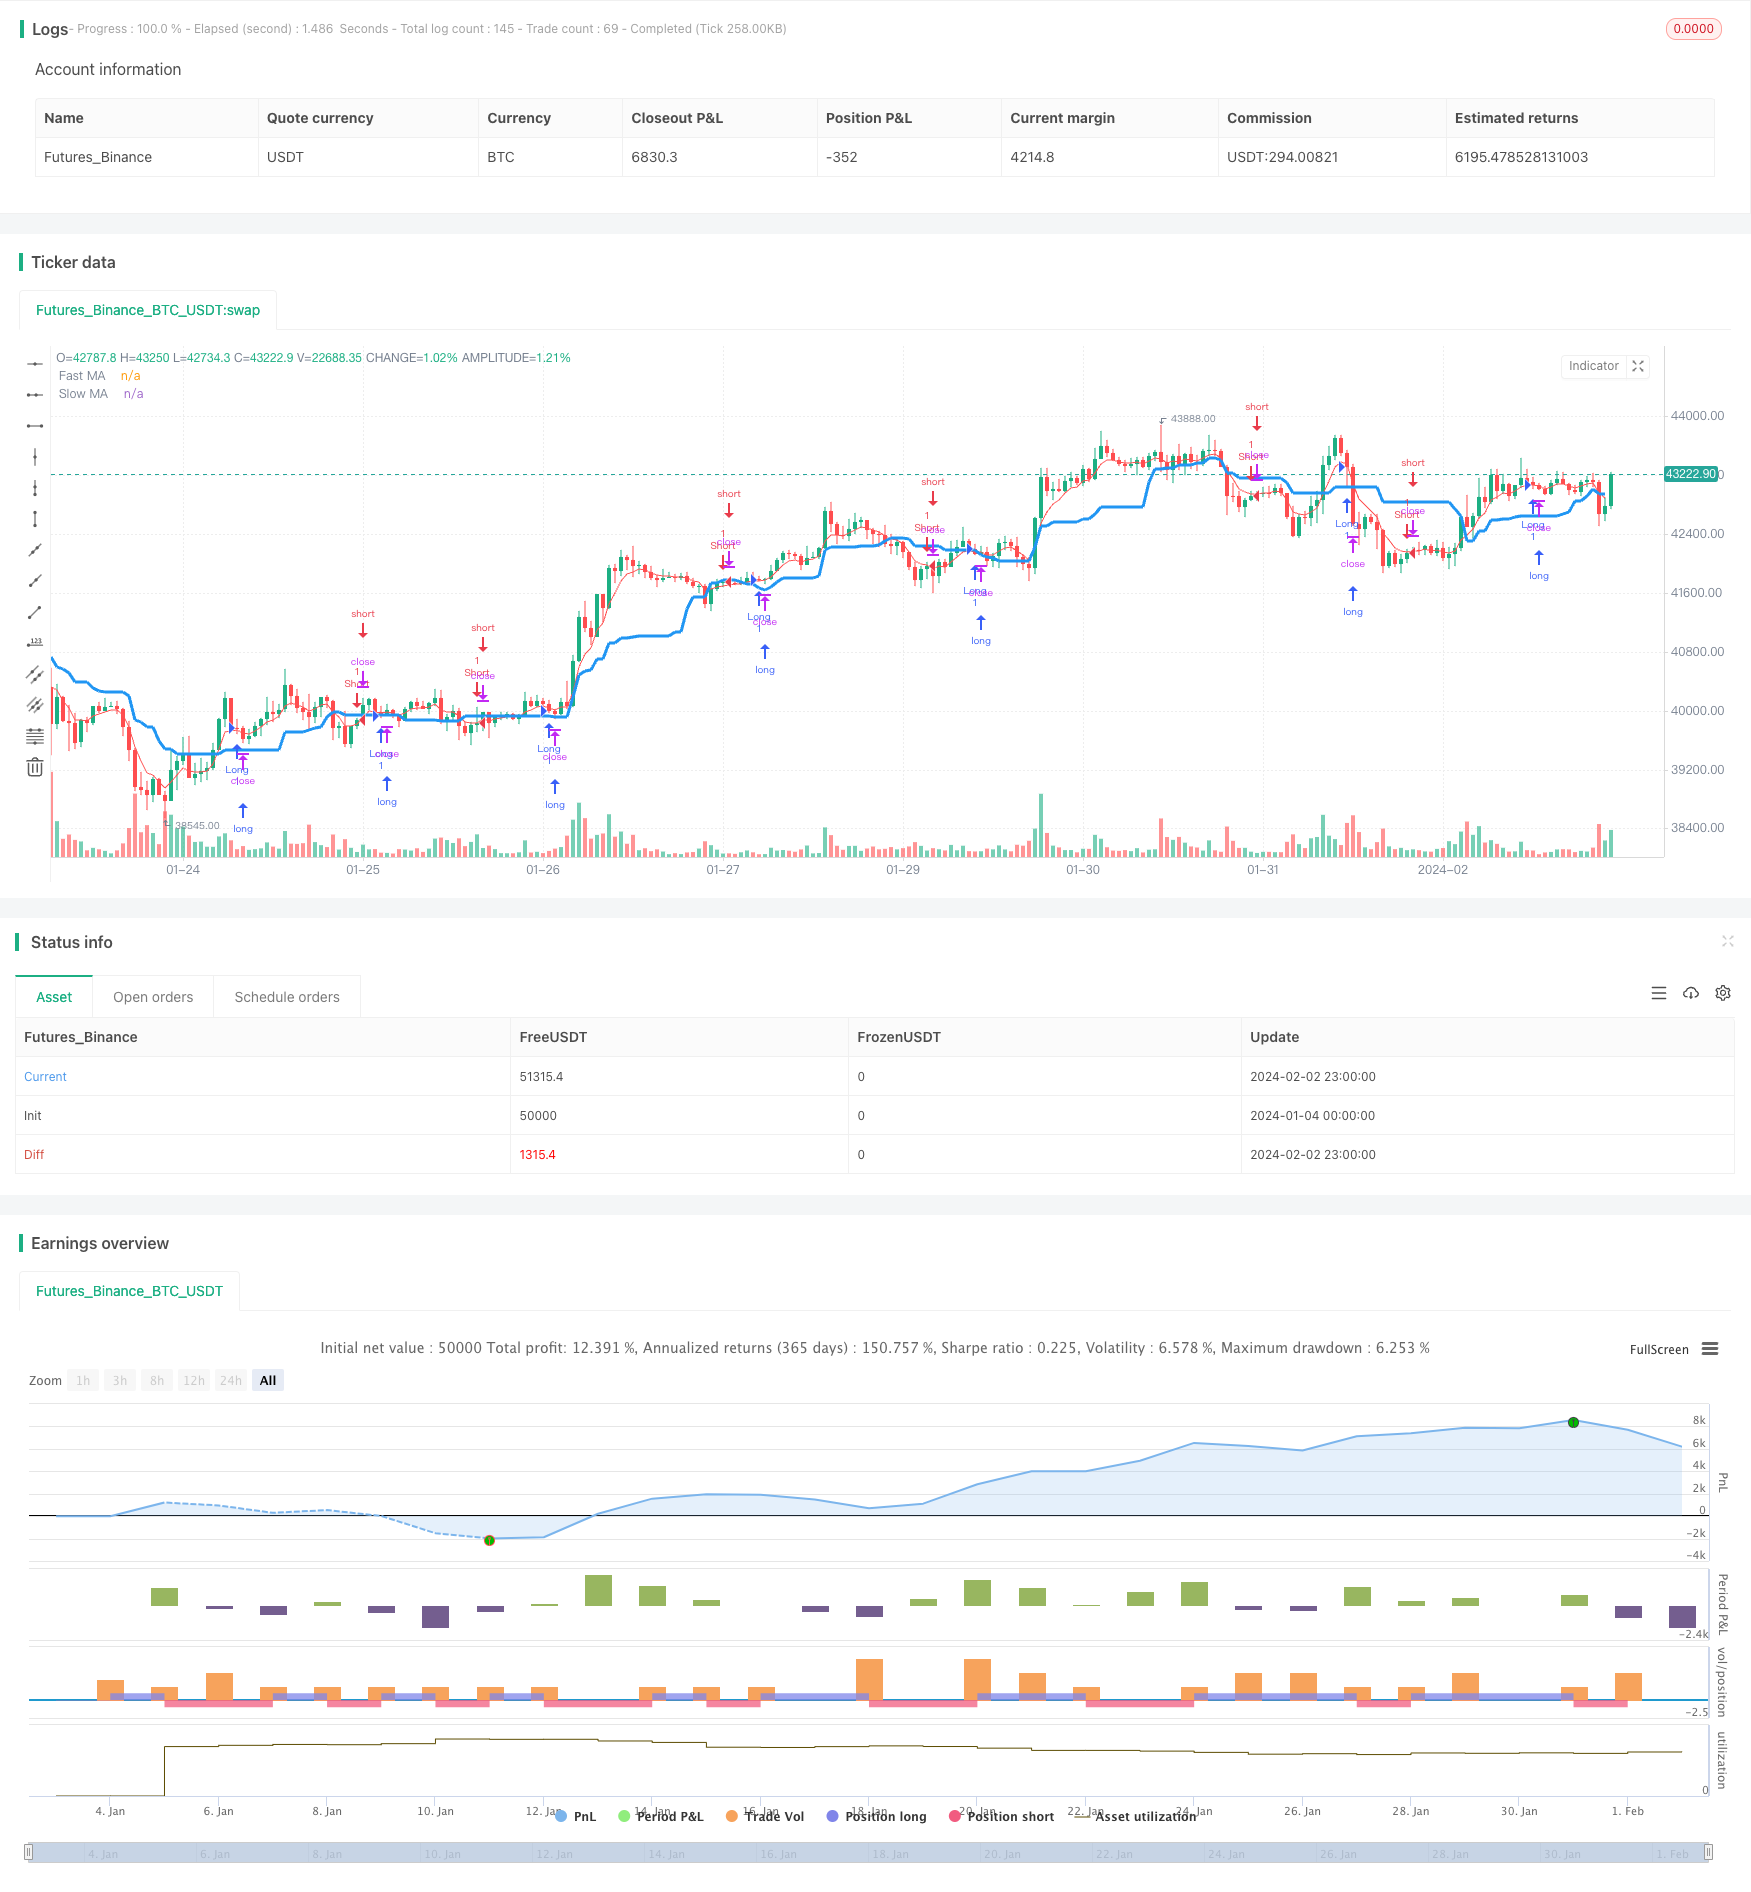
二重移動平均トレンド追跡戦略 (Dual Moving Average Trend Tracking Strategy) は,急速移動平均と遅い移動平均の組み合わせを用いてトレンドの方向を判断し,K線実体色の入場信号として組み合わせる量化取引戦略である.この戦略は,トレンド追跡と反転取引の両方の特徴を有する.
戦略原則
この戦略は,長さ20のゆっくりとした移動平均を使用して,全体的なトレンドの方向を判断し,価格が上を走るときは上昇傾向と判断し,価格が下を走るときは下落傾向と判断する.同時に,長さ5の急速移動平均を入場フィルターとして使用し,価格が急速移動平均を突破したときにのみ取引を発信する. さらに,この戦略は,近隣のN根K線の実体色をチェックし,実体色が連続して赤に変化するときに,上昇傾向を組み合わせて複数の信号を発信し,実体色が連続して緑に変化するときに,下を走る傾向を組み合わせて空の信号を発信し,偽の突破を防ぐ.
この戦略は,全体的な傾向,短期平均線,K線実体という3つの次元に関する情報を総合的に判断し,取引信号の信頼性を高めます. 取引信号は,3つの方向が一致するときに発信され,一部のノイズを効果的にフィルターします.
戦略的優位性
トレンドフォローと反転取引の特徴を持ち,異なる市場環境に適応できる.
取引シグナル発信前に多次元判断を行い,偽信号を効果的にフィルターし,勝率を向上させる.
参数最適化スペースは広大で,移動平均の長さ,K線実体色の判断根数などの参数により最適化することができる.
戦略の論理は明確で簡潔で,理解しやすく,初心者向けに適しています.
戦略リスク
大規模な振動状況では,osing streakが形成されやすく,大きな引き下がりを引き起こす.移動平均のパラメータを適切に調整したり,ストップを入れることで回避することができる.
横盤整理段階では,ウィップソーが形成されやすいため,損失を伴う。K線実体色の判断の根数を適切に調整するか,反転取引を閉じることができる。
適切なパラメータ設定を確実にするための十分な反省が必要です.
最適化の方向
指数移動平均,カフマン自律移動平均など,様々な種類の移動平均を試してみてください.
固定取引量や口座権益による調整など,取引量制御を増やす.
ストップ・アウトの追加 ストップ・アウトは,価格が再びスロー・ムービング・アベレンスを下回ったときに考えられます.
戦略の安定性や適応性を判断するために,様々な種をテストすることができます.
要約する
双移動均線トレンド追跡戦略は,トレンド判断と反転取引を組み合わせて,中長線トレンドの余剰を効果的に捕捉することができ,ショートラインでも追加収益を得ることができます.パラメータの最適化とメカニズム強化により,利益の余地をさらに拡大することができます.この戦略の論理は,シンプルで明快で,初心者学習研究に非常に適しています.しかし,いかなる戦略も,安定性と収益性を確保するために,さまざまな品種とパラメータの下で充分な検証が必要です.
/*backtest
start: 2024-01-04 00:00:00
end: 2024-02-03 00:00:00
period: 1h
basePeriod: 15m
exchanges: [{"eid":"Futures_Binance","currency":"BTC_USDT"}]
*/

//@version=2
strategy(title = "Noro's Trend MAs 1.5", shorttitle = "Trend MAs 1.5", overlay=true, default_qty_type = strategy.percent_of_equity, default_qty_value=100.0, pyramiding=0)

//Settings
needlong = input(true, "long")
needshort = input(true, "short")
type = input(7, defval = 7, minval = 1, maxval = 7, title = "Type of Slow MA")
src = input(close, defval = close, title = "Source of Slow MA")
usefastsma = input(true, "Use fast MA Filter")
fastlen = input(5, defval = 5, minval = 1, maxval = 50, title = "fast MA Period")
len = input(20, defval = 20, minval = 2, maxval = 200, title = "slow MA Period")
bars = input(2, defval = 2, minval = 0, maxval = 3, title = "Bars Q")

fastsma = ema(src, fastlen)

//DEMA
dema = 2 * ema(src, len) - ema(ema(close, len), len)

//TEMA
xPrice = close
xEMA1 = ema(src, len)
xEMA2 = ema(xEMA1, len)
xEMA3 = ema(xEMA2, len)
tema = 3 * xEMA1 - 3 * xEMA2 + xEMA3

//KAMA
xvnoise = abs(src - src[1])
nfastend = 0.20
nslowend = 0.05
nsignal = abs(src - src[len])
nnoise = sum(xvnoise, len)
nefratio = iff(nnoise != 0, nsignal / nnoise, 0)
nsmooth = pow(nefratio * (nfastend - nslowend) + nslowend, 2)
kama = nz(kama[1]) + nsmooth * (src - nz(kama[1]))

//PriceChannel
lasthigh = highest(src, len)
lastlow = lowest(src, len)
center = (lasthigh + lastlow) / 2

//Trend
ma = type == 1 ? sma(src, len) : type == 2 ? ema(src, len) : type == 3 ? vwma(src, len) : type == 4 ? dema : type == 5 ? tema : type == 6 ? kama : type == 7 ? center : 0
trend = low > ma ? 1 : high < ma ? -1 : trend[1]

//Bars
bar = close > open ? 1 : close < open ? -1 : 0
redbars = bars == 0 ? 1 : bars == 1 and bar == -1 ? 1 : bars == 2 and bar == -1 and bar[1] == -1 ? 1 : bars == 3 and bar == -1 and bar[1] == -1 and bar[2] == -1 ? 1 : 0
greenbars = bars == 0 ? 1 : bars == 1 and bar == 1 ? 1 : bars == 2 and bar == 1 and bar[1] == 1 ? 1 : bars == 3 and bar == 1 and bar[1] == 1 and bar[2] == 1 ? 1 : 0

//Signals
up = trend == 1 and (low < fastsma or usefastsma == false) and redbars == 1 ? 1 : 0
dn = trend == -1 and (high > fastsma or usefastsma == false) and greenbars == 1 ? 1 : 0

//Lines
colorfastsma = usefastsma == true ? red : na
plot(fastsma, color = colorfastsma, title = "Fast MA")
plot(ma, color = blue, linewidth = 3, transp = 0, title = "Slow MA")

//Trading
longCondition = up == 1
if (longCondition)
    strategy.entry("Long", strategy.long, needlong == false ? 0 : na)

shortCondition = dn == 1
if (shortCondition)
    strategy.entry("Short", strategy.short, needshort == false ? 0 : na)