ジンセン1分オシレーション戦略

1
Follow
1782
Followers
概要
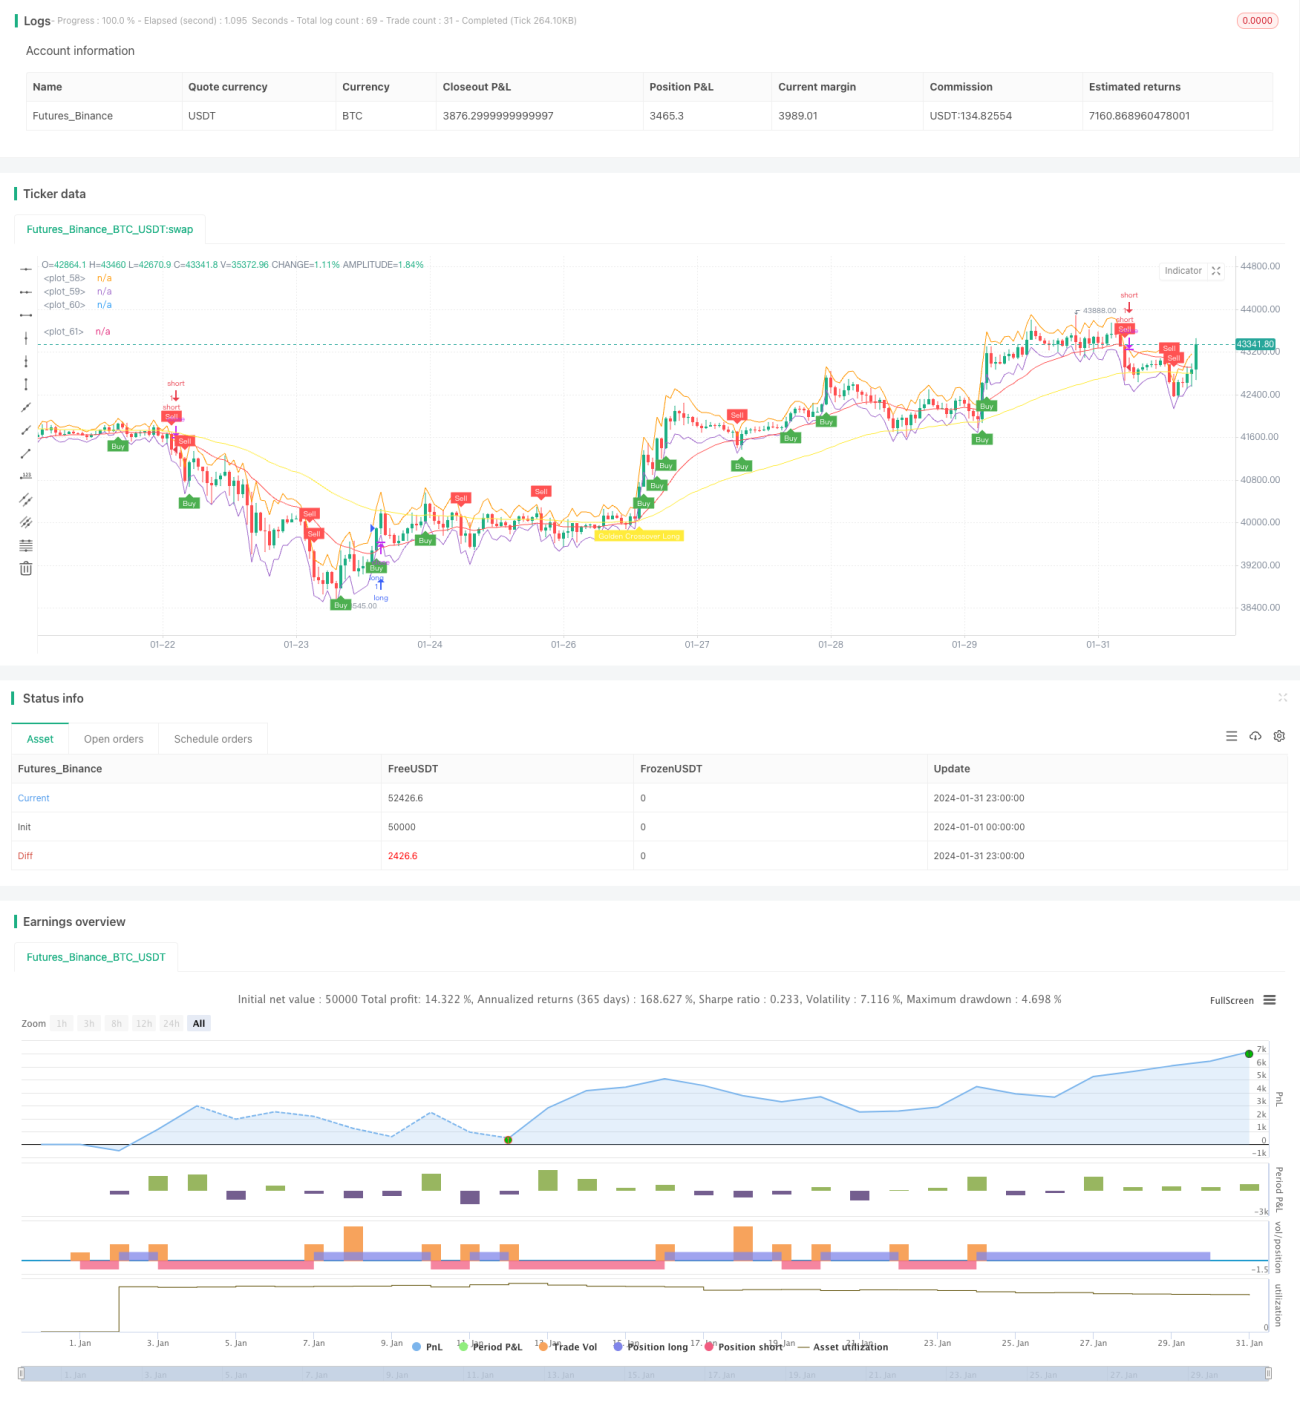
金森1分震動戦略 (Gem Forest One Minute Scalping Strategy) は,短線量化取引戦略である.この戦略は,複数の指標を総合的に適用して,1分間の時間枠内の市場の震動特性を識別し,それに基づいて長短ポジションを切り替えて,超短線セールスを実現する.
戦略原則
- ATR指標は,価格変動の範囲を判断するために,上下を構成しています.
- EMA指数は金叉死叉の取引シグナルを構築している
- 双RSI指標は金叉のデッドフォークシグナルを確認した
- 指数信号と価格位置を組み合わせて,特定のエントリーポイントとエグジットポイントを決定します.
価格が下線を下回ったとき,急激なEMAは金叉を形成し,快線RSI上は慢線RSIを貫通し,買入シグナルを生成する.価格が上線上より高いとき,急激なEMAは死叉を形成し,快線RSI下は慢線RSIを貫通し,売り出シグナルを生成する.入場後,止損と止まりの退出を設定する.
優位分析
- 複数の指標の組み合わせ,総合的な判断,高い信頼性
- 戦略操作の頻度が高く,収益の余地が強い
- 戦略の撤回 小さい 安定性良好
- 1分またはそれ以下の周期で超短線アベリゲートが可能
リスク分析
- 超短線操作,ネットワークとハードウェアに対する要求が高い
- 超短線は過剰取引や資金分散を招く
- 指示器を正しく設定しない場合,誤った信号が発生する可能性があります.
- 特定の市場の状況により,急激な変動で損をする可能性が高い
これらのリスクに対応して,指標パラメータを最適化し,ストップ・ストップの方法を調整し,一日の最大取引回数を適切に制限し,流動性が良い,波動率が適度な取引品種を選択することができます.
戦略最適化の方向性
- テスト結果に対する異なるATR周期パラメータの影響
- EMAの種類を試すか,または EMAの1つを他の指標に変更する
- RSI周期パラメータを調整するか,KDJ,ストキャスティクスなどの他の振動指標を試す
- エントリー・ポイントの最適化方法,例えば,トレンドの判断に多くの要素を組み合わせる方法
- 利益リスク比を最適化するためにストップ・ロスト・ストップポイントを調整する
要約する
金森1分震動戦略は,超短線量化取引の特性を十分に考慮し,指標パラメータの設定は合理的で,複数の指標の確認と組み合わせを使用し,信頼性が高く,リスクを厳格に制御する前提下では,強力な収益の可能性があり,十分な操作能力と心理的な資質を持つ投資家にとって非常に適しています.
Source
Pine
Strategy parameters
Related strategies
Comment
All comments (0)
No data
- 1