ビッグトレンドインジケーターロング戦略

1
Follow
1782
Followers
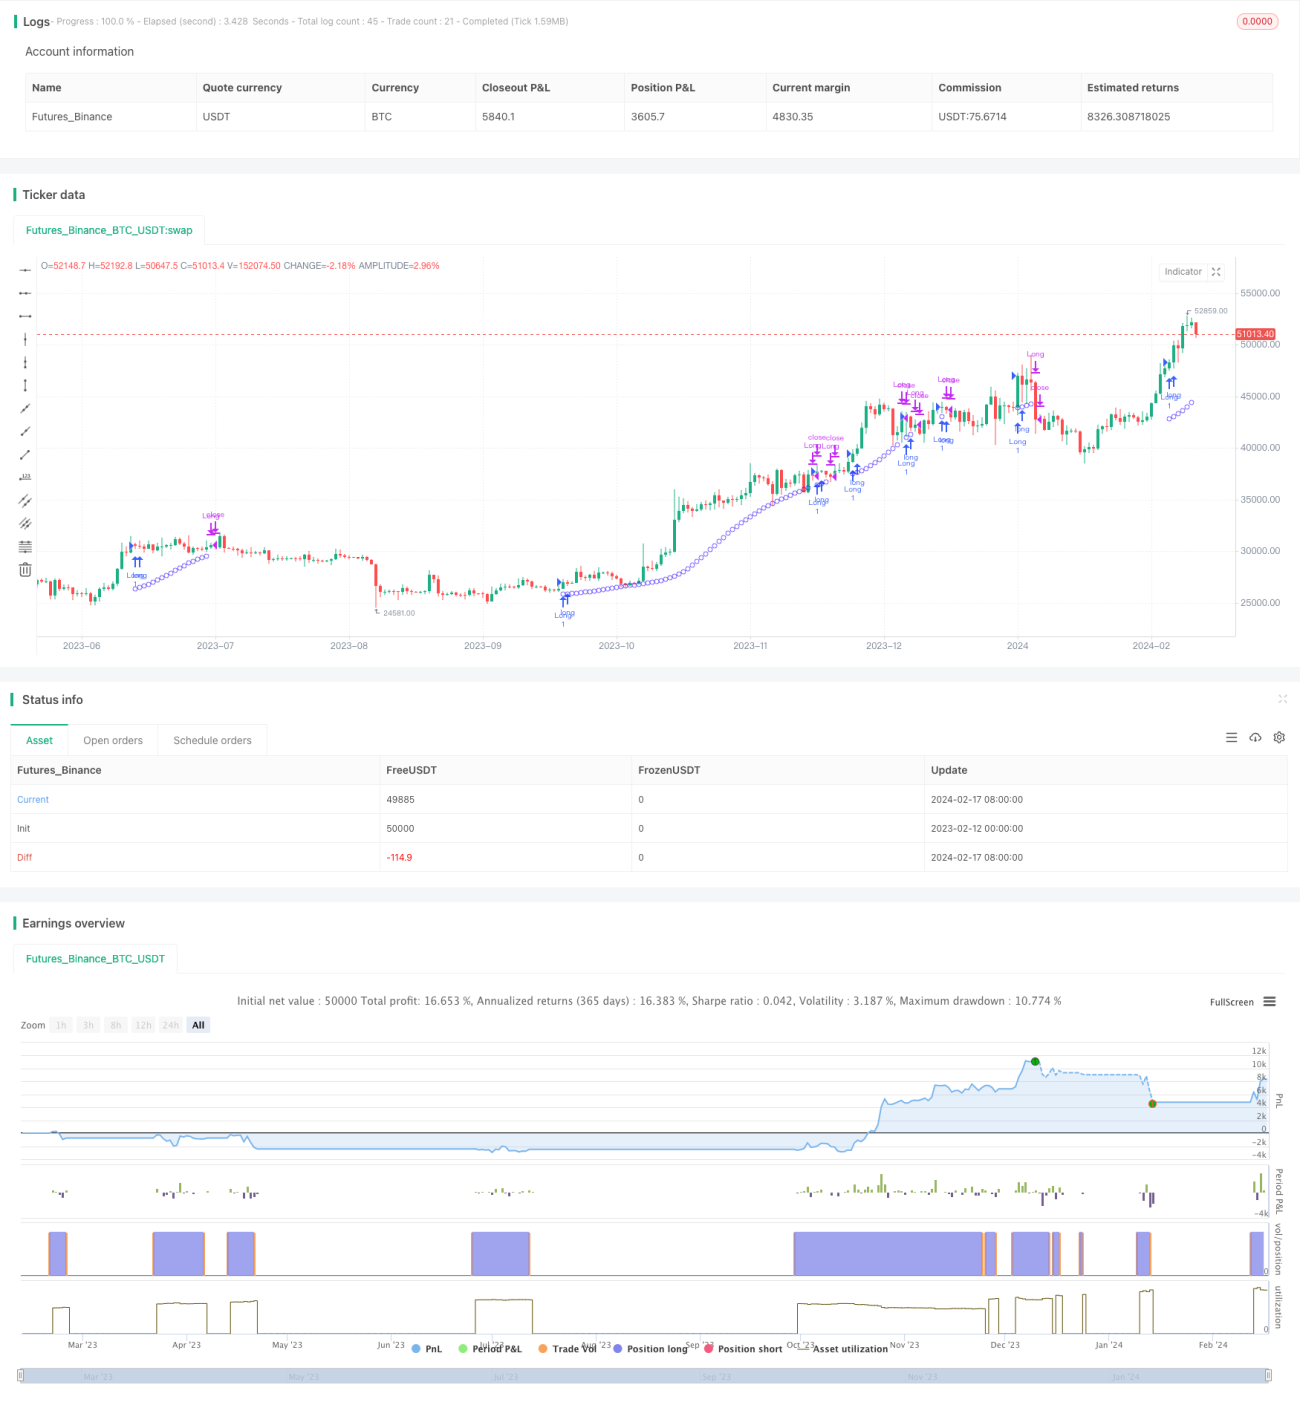
概要
メジャー・トレンド・インジケーター・ロング (MTIL) は,様々な金融機関 (暗号通貨であるビットコイン,イーサリアム,そしてAppleなどの伝統的な株式を含む) に適用される取引戦略である.これは,潜在的多頭トレンドを特定して,ロングラインを設定するために設計されている.
戦略原則
MTIL策略は,最適化されたパラメータを使用して,特定の回顧周期内の最高価格と最低価格を計算します. 線形回帰法を使用して,価格データをスムーズに処理し,潜在的なブルマーケットのトレンドを識別し,複数の信号を発信します.
具体的には,この戦略は,まず特定の周期内の最高値と最低値を計算する. そして,異なるパラメータの線形回帰を使用して最高値と最低値を平滑化する. これは,上位と下位を生成する. 平滑後の最高価格ラインが上位と下位を突破し,収束価格の短期線形回帰が長期線形回帰よりも高いとき,多頭信号が生成される.
優位分析
MTIL戦略は以下の利点があります.
- 二重平滑技術による傾向認識,高精度
- 戦略の履歴をテストするために,再測開始時間を調整できます.
- 顧客が自分の取引の好みに合わせて設定できるパラメータ
- 空頭戦略と組み合わせて,複数の時間軸分析を実現
リスク分析
MTIL戦略には以下のリスクもあります.
- トレンド取引はリスクがあり,損失が拡大する可能性がある
- パラメータを正しく設定しない場合,機会を逃すか,誤ったシグナルを引き起こす可能性があります.
- 取引コストを適切に考慮し,頻繁に取引を避ける
パラメータの調整,ストップロスの設定,取引コストの制御などの方法によって,部分的なリスクを回避できます.
最適化の方向
MTILの戦略は以下の点で最適化できます.
- 異なる周期パラメータの組み合わせをテストし,最適なパラメータを探します.
- 価格確認のメカニズムの追加で,誤った信号を回避する
- 判断力や時間軸の動きを他の指標と組み合わせて,信号をさらに確認します.
- ストップ・ロスト・ストップ・ストップ・ストラトジーを設定し,単発損失と全局的な利益を制御する
要約する
MTILは,線形回帰技術を利用して大トレンドを識別する多頭戦略である.これは,パラメータを調整することで,異なる市場環境に適用できる.空頭戦略の組み合わせで使用すると,より包括的な分析を提供することができる.最適化調整を経て,その正確性と収益性の両方が向上することができる.
Source
Pine
Related strategies
Comment
All comments (0)
No data
- 1