一目均衡表+シフトトレンド重ね合わせ定量戦略
概要
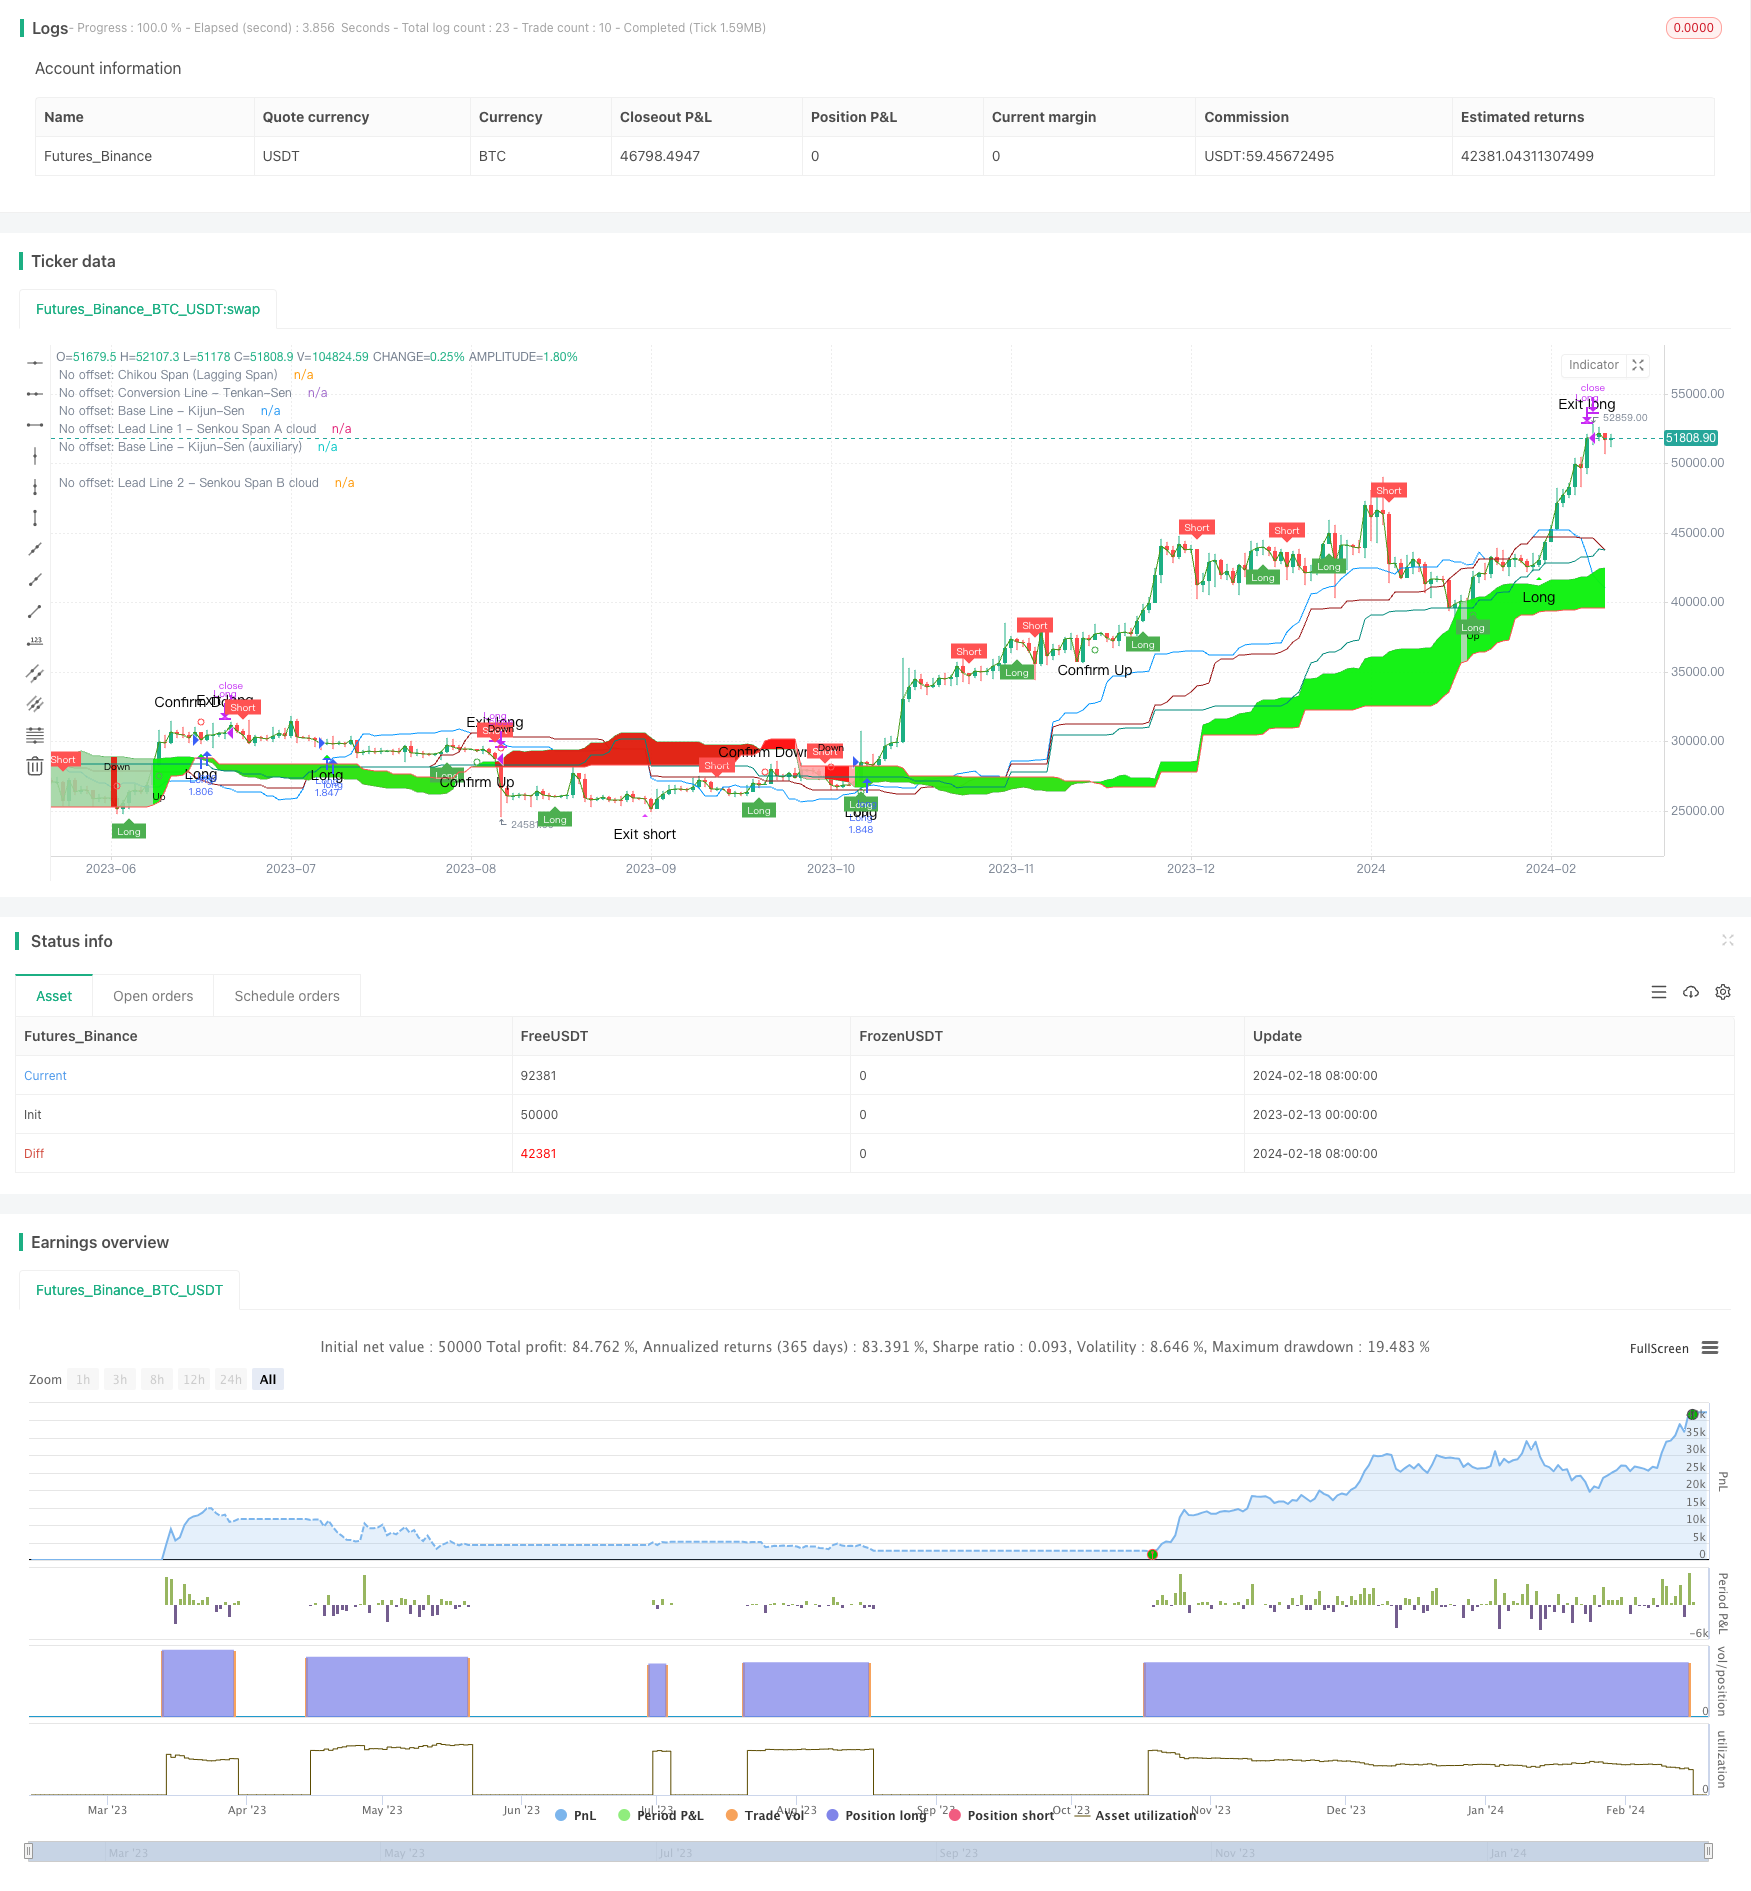
この戦略は,一目平衡指標と移転叠加指標の組み合わせで,株価の潜在的傾向を発見し,買入と売却のタイミングを判断する.この戦略は,一目平衡線を計算し,移転叠加指標と組み合わせて,トレンドの方向を判断し,取引信号を発信し,同時にRSI指標を使用してフィルタリングを行い,取引リスクを制御する.
戦略原則
この戦略は主に3つの部分から構成されています.
一目平衡指標:一目平衡指標は,主にターニングポイント ((Tenkan-Sen) ・ベースポイント ((Kijun-sen) の2つの線を用い,一目平衡の形を形成する.ターニングポイントラインは,価格の短期的傾向を代表し,ベースポイントラインは,価格の中間的傾向を代表する.ターニングポイントラインとベースポイントラインの交差は,買入と売却の信号を構成する.
移転相乗指数: 移転相乗指数は,分散相対値区間帯と滑り相乗値を計算することによって,トレンドの方向を判断する. 価格が外側区域帯から中間区域帯に入るとき,取引信号が生じる.
RSI指標:RSI指標は,価格がオーバーストラップまたはオーバーセールしているかどうかを判断するために使用され,オーバーバイラインとオーバーセール区間を設定し,動きの重複指標と組み合わせた取引信号を判断して,買入と売り出し信号を発出します.
具体的には,この戦略は,金叉 (指数線を交差する) と死叉 (指数線を交差する) が発生しているかどうかを監視し,買い出品のタイミングを判断します. 同時に,移動の重複指標を組み合わせて,全体的なトレンドの方向を判断します. 両方の指標が同時にシグナルを発信する場合は,RSI指標が超買いと超売りがないことを示す場合は,取引信号を発信します.
戦略的優位性
この戦略は,トレンドの方向と取引のタイミングを判断するさまざまな指標を組み合わせて,判断の正確性を向上させ,指標間の互補の利点を利用し,単一の指標判断の誤差の確率を避けることができます.具体的利点は次のとおりです.
タービングポイントラインとベースポイントラインを使用して,目次均衡指標を構成し,短期トレンドと中期トレンドを同時に反映し,単一のMA指標よりも高い精度で判断することができる.
移動重複指標は,全体的なトレンド方向を正確に判断し,一見均衡指標と互補を形成する.
RSIは,偽ブレイクを効果的にフィルターし,取引リスクを回避するためにフィルター条件を設定します.
この戦略は,簡単に理解し,実行し,量化取引に適用できます.
戦略リスク
複数の指標を組み合わせて判断することで,誤判の可能性を一定程度に減らすことができますが,主なリスクは以下の通りです.
パラメータ設定のリスク. 転換点線,基準点線などの指標パラメータの設定が不適切である場合,取引信号の誤りが生じます. パラメータを異なる品種に適応するように最適化する必要があります.
トレンド反転リスク。 整合の状況では,偽の信号が生じることがあります。 トレンド反転信号を判断するために,より多くの指標を組み合わせる必要があります。
RSIフィルタリング条件が厳格すぎるリスク.より多くの取引機会を排除する可能性がある.RSIのパラメータを適切に緩和することができます.
対応方法:
より多くの歴史データを使用して,異なる品種に対してパラメータを最適化して,パラメータ設定が合理的であることを確認します.
策略にストップ・メカニズムを加える. 価格が逆の方向にストップ・ラインを破るとき,ポジションを退出する.
RSIのパラメータを最適化し,フィルタリング条件を適切に緩和し,リスク管理を保証する前提で,より多くの取引機会を得ます.
戦略最適化の方向性
この戦略はさらに改善できる方向もあります.
機械学習アルゴリズムを追加し,市場変化に合わせて戦略パラメータを動的に調整し,戦略の適応性を向上させる.
戦略のコンポーネントをモジュールにパッケージ化して,モジュール化管理を行い,コンポーネントを迅速に交換したり,個別にテストして最適化するコンポーネントを容易にし,開発効率を高めます.
データの統合モジュールを追加し,より多くのデータソースから市場データを取得し,高品質のトレーニングセットを構成し,機械学習の効果を向上させる.
戦略の全面的な反省,様々な評価指標を記録し,パラメータの最適化調整とモデル選択を補助する反省ツールを開発する.
クラウドコンピューティングプラットフォームを使用して,戦略システムを展開し,柔軟なコンピューティングリソースを利用して,高速な並列反省を行い,パラメータ調整の繰り返しを加速し,戦略開発コストを削減します.
要約する
この戦略は,一目平衡指標と移転叠加指標の2つの指標を配合して,互いを補足して価格の傾向と取引タイミングを判断する.同時に,RSI指標を使用してフィルタリングを行い,取引リスクを制御する.この多指標の組み合わせ戦略形式は,判断の正確性を向上させ,より良い戦略効果を得る.しかし,戦略内のパラメータ設定と指標選択は,異なる品種に対して継続的なテストと最適化が必要である.戦略のパラメータ調整と指標選択は,異なる製品に対して継続的なテストと最適化が必要である.
/*backtest
start: 2023-02-13 00:00:00
end: 2024-02-19 00:00:00
period: 1d
basePeriod: 1h
exchanges: [{"eid":"Futures_Binance","currency":"BTC_USDT"}]
*/

// This source code is subject to the terms of the Mozilla Public License 2.0 at https://mozilla.org/MPL/2.0/
// © KryptoNight

//@version=4
// comment/uncomment Study/Strategy to easily switch modes
// study("Ichimoku Kinko Hyo Cloud - no offset - no repaint - RSI filter - alerts", shorttitle="IchiCloud + RSI - alerts", overlay=true)
// ============================================================================== Strategy mode - uncomment to activate
strategy("Ichimoku Kinko Hyo Cloud - no offset - no repaint - RSI filter - strategy", shorttitle="IchiCloud + RSI - Strategy Tester Mode", overlay=true, pyramiding = 0,
  currency = currency.EUR, initial_capital = 2000, default_qty_type = strategy.percent_of_equity, default_qty_value = 100,
  calc_on_every_tick = true, calc_on_order_fills = true, commission_type = strategy.commission.percent, commission_value = 0.15)
// ==============================================================================

// ------------------------------------------------------------------------------

ichiCloud_offset   = input(false, title="Standard Ichimoku Cloud")                  // with the visual offset
ichiCloud_noOffset = input(true,  title="Ichimoku Cloud - no offset - no repaint")  // without the visual offset

conversion_prd = input(9, minval=1, title="Conversion Line Period - Tenkan-Sen")
baseline_prd   = input(27, minval=1, title="Base Line Period - Kijun-Sen")
baselineA_prd  = input(52, minval=1, title="Base Line Period - Kijun-Sen (auxiliary)")
leadingSpan_2prd = input(52, minval=1, title="Lagging Span 2 Periods - Senkou Span B")
displacement = input(26, minval=0, title="Displacement: (-) Chikou Span; (+) Senkou Span A")
extra_bars = input(1, minval=0, title="Displacement: additional bars")
laggingSpan_src = input(close, title="Lagging Span price source - Chikou-Span")

donchian(len) => avg(lowest(len), highest(len))
displ = displacement-extra_bars
// ------------------------------------------------------------------------------
// OFFSET:
conversion = donchian(conversion_prd)   // Conversion Line - Tenkan-Sen (9 Period)
baseline  = donchian(baseline_prd)      // Base Line - Kijun-Sen (26 Period)
baselineA = donchian(baselineA_prd)     // Base Line Period - Kijun-Sen (auxiliary)
leadingSpanA = avg(conversion, baseline)
leadingSpanB = donchian(leadingSpan_2prd)
laggingSpan = laggingSpan_src

// Color - bullish, bearish
col_cloud = leadingSpanA>=leadingSpanB ? color.green : color.red

// Cloud Lines
spanA = plot(ichiCloud_offset? leadingSpanA : na, offset=displ, title="Offset: Lead Line 1 - Senkou Span A cloud", color=color.green)
spanB = plot(ichiCloud_offset? leadingSpanB : na, offset=displ, title="Offset: Lead Line 2 - Senkou Span B cloud", color=color.red)
fill(spanA, spanB, color=col_cloud, transp=80, title="Offset: Ichimoku Cloud - Leading Span 1 & 2 based coloring")

// Other Lines
conversion_p = plot(ichiCloud_offset? conversion : na, title="Offset: Conversion Line - Tenkan-Sen", color=#0496ff)
standard_p = plot(ichiCloud_offset? baseline : na, title="Offset: Base Line - Kijun-Sen", color=#991515)
standardA_p = plot(ichiCloud_offset? baselineA : na, title="Offset: Base Line - Kijun-Sen (auxiliary)", color=color.teal)
lagging_Span_p = plot(ichiCloud_offset? laggingSpan : na, offset=-displ, title="Offset: Chikou Span (Lagging Span)", color=#459915)

// ------------------------------------------------------------------------------
// NO OFFSET:
conversion_noOffset = conversion[displ] // Conversion Line - Tenkan-Sen (9 Period)
baseline_noOffset  = baseline[displ]    // Base Line - Kijun-Sen (26 Period)
baselineA_noOffset = baselineA[displ]   // Base Line Period - Kijun-Sen (auxiliary)
leadingSpanA_noOffset = leadingSpanA[displ*2]
leadingSpanB_noOffset = leadingSpanB[displ*2]
laggingSpan_noOffset = laggingSpan[0]

// Color - bullish, bearish
col_cloud_noOffset = leadingSpanA_noOffset>=leadingSpanB_noOffset ? color.green : color.red

// Cloud Lines
spanA_noOffset = plot(ichiCloud_noOffset? leadingSpanA_noOffset : na, title="No offset: Lead Line 1 - Senkou Span A cloud", color=color.green, transp=0)
spanB_noOffset = plot(ichiCloud_noOffset? leadingSpanB_noOffset : na, title="No offset: Lead Line 2 - Senkou Span B cloud", color=color.red, transp=0)
fill(spanA_noOffset, spanB_noOffset, color=col_cloud_noOffset, transp=80, title="No offset: Ichimoku Cloud - Leading Span 1 & 2 based coloring")

// Other Lines
conversion_p_noOffset = plot(ichiCloud_noOffset? conversion_noOffset : na, title="No offset: Conversion Line - Tenkan-Sen", color=#0496ff, transp=0)
baseline_p_noOffset = plot(ichiCloud_noOffset? baseline_noOffset : na, title="No offset: Base Line - Kijun-Sen", color=#991515, transp=0)
baselineA_p_noOffset = plot(ichiCloud_noOffset? baselineA_noOffset : na, title="No offset: Base Line - Kijun-Sen (auxiliary)", color=color.teal, transp=0)
laggingSpan_p_noOffset = plot(ichiCloud_noOffset? laggingSpan_noOffset : na, title="No offset: Chikou Span (Lagging Span)", color=#459915, transp=0)

// ==============================================================================
// Conditions & Alerts (based on the lines without offset)

maxC = max(leadingSpanA_noOffset,leadingSpanB_noOffset)
minC = min(leadingSpanA_noOffset,leadingSpanB_noOffset)

// Trend start signals: crosses between Chikou Span (Lagging Span) and the Cloud (Senkou Span A, Senkou Span B)
uptrend_start   = crossover(laggingSpan_noOffset,maxC)
downtrend_start = crossunder(laggingSpan_noOffset,minC)

// Trends
uptrend   = laggingSpan_noOffset>maxC // Above Cloud
downtrend = laggingSpan_noOffset<minC // Below Cloud

// No trend: choppy trading - the price is in transition
notrend = maxC>=laggingSpan_noOffset and laggingSpan_noOffset>=minC

// Confirmations
uptrend_confirm   = crossover(leadingSpanA_noOffset,leadingSpanB_noOffset)
downtrend_confirm = crossunder(leadingSpanA_noOffset,leadingSpanB_noOffset)

// Signals - crosses between Conversion Line (Tenkan-Sen) and Base Line (Kijun-Sen)
bullish_signal = crossover(conversion_noOffset,baseline_noOffset)
bearish_signal = crossunder(conversion_noOffset,baseline_noOffset)

// Various alerts
alertcondition(uptrend_start,   title="Uptrend Started",   message="Uptrend Started")
alertcondition(downtrend_start, title="Downtrend Started", message="Downtrend Started")

alertcondition(uptrend_confirm,   title="Uptrend Confirmed",   message="Uptrend Confirmed")
alertcondition(downtrend_confirm, title="Downtrend Confirmed", message="Downtrend Confirmed")

alertcondition(bullish_signal, title="Buy Signal",  message="Buy Signal")
alertcondition(bearish_signal, title="Sell Signal", message="Sell Signal")

rsi_OBlevel = input(50, title="RSI Filter: Overbought level (0 = off)")
rsi_OSlevel = input(100,title="RSI Filter: Oversold level (100 = off)")
rsi_len = input(14,title="RSI Length")
rsi_src = input(close,title="RSI Price source")
rsi = rsi(rsi_src,rsi_len)

// Strategy -------------------------------
long_signal  = bullish_signal and uptrend   and rsi<=rsi_OSlevel // breakout filtered by the rsi
exit_long    = bearish_signal and uptrend
short_signal = bearish_signal and downtrend and rsi>=rsi_OBlevel // breakout filtered by the rsi
exit_short   = bullish_signal and downtrend

// Strategy alerts
alertcondition(long_signal, title="Long Signal - Uptrend",      message="Long Signal - Uptrend")
alertcondition(exit_long,   title="Long Exit Signal - Uptrend", message="Long Exit Signal - Uptrend")

alertcondition(short_signal, title="Long Signal - Downtrend",       message="Long Signal - Downtrend")
alertcondition(exit_short,   title="Short Exit Signal - Downtrend", message="Short Exit Signal - Downtrend")

// Plot areas for trend and transition
color_trend = uptrend? #00FF00 : downtrend? #FF0000 : notrend? color.new(#FFFFFF, 50) : na
fill(spanA_noOffset, spanB_noOffset, color=color_trend, transp=90, title="No offset: Ichimoku Cloud - Lagging Span & Cloud based coloring")

plotshape(ichiCloud_noOffset?uptrend_start:na, title="No offset: Uptrend Started", color=color.green, style=shape.circle, location=location.belowbar, size=size.tiny, text="Up")
plotshape(ichiCloud_noOffset?downtrend_start:na, title="No offset: Downtrend Started", color=color.red, style=shape.circle,location=location.abovebar, size=size.tiny, text="Down")

plotshape(ichiCloud_noOffset?uptrend_confirm:na, title="No offset: Uptrend Confirmed", color=color.green, style=shape.circle, location=location.belowbar, size=size.small, text="Confirm Up")
plotshape(ichiCloud_noOffset?downtrend_confirm:na, title="No offset: Downtrend Confirmed", color=color.red, style=shape.circle, location=location.abovebar, size=size.small, text="Confirm Down")

plotshape(ichiCloud_noOffset?long_signal:na, title="No offset: Long Signal", color=#00FF00, style=shape.triangleup, location=location.belowbar, size=size.small, text="Long")
plotshape(ichiCloud_noOffset?exit_long:na, title="No offset: Exit Long Signal", color=color.fuchsia, style=shape.triangledown, location=location.abovebar, size=size.small, text="Exit long")

plotshape(ichiCloud_noOffset?short_signal:na, title="No offset: Short Signal", color=#FF0000, style=shape.triangledown, location=location.abovebar, size=size.small, text="Short")
plotshape(ichiCloud_noOffset?exit_short:na, title="No offset: Exit Short Signal", color=color.fuchsia, style=shape.triangleup, location=location.belowbar, size=size.small, text="Exit short")

// ============================================================================== Strategy Component - uncomment to activate
if (long_signal)
    strategy.entry("Long",strategy.long)
if (exit_long)
    strategy.close("Long")
// if (short_signal)
//    strategy.entry("Short",strategy.short)
// if (exit_short)
//    strategy.close("Short")
// ==============================================================================


//@version=4
// This source code is subject to the terms of the Mozilla Public License 2.0 at https://mozilla.org/MPL/2.0/
// © colinmck


RSI_Period = input(10, title='RSI Length')
SF = input(5, title='RSI Smoothing')
QQE = input(2.438, title='Fast QQE Factor')
ThreshHold = input(10, title="Thresh-hold")

src = close
Wilders_Period = RSI_Period * 3 - 1

Rsi = rsi(src, RSI_Period)
RsiMa = ema(Rsi, SF)
AtrRsi = abs(RsiMa[1] - RsiMa)
MaAtrRsi = ema(AtrRsi, Wilders_Period)
dar = ema(MaAtrRsi, Wilders_Period) * QQE

longband = 0.0
shortband = 0.0
trend = 0

DeltaFastAtrRsi = dar
RSIndex = RsiMa
newshortband = RSIndex + DeltaFastAtrRsi
newlongband = RSIndex - DeltaFastAtrRsi
longband := RSIndex[1] > longband[1] and RSIndex > longband[1] ? max(longband[1], newlongband) : newlongband
shortband := RSIndex[1] < shortband[1] and RSIndex < shortband[1] ? min(shortband[1], newshortband) : newshortband
cross_1 = cross(longband[1], RSIndex)
trend := cross(RSIndex, shortband[1]) ? 1 : cross_1 ? -1 : nz(trend[1], 1)
FastAtrRsiTL = trend == 1 ? longband : shortband

// Find all the QQE Crosses

QQExlong = 0
QQExlong := nz(QQExlong[1])
QQExshort = 0
QQExshort := nz(QQExshort[1])
QQExlong := FastAtrRsiTL < RSIndex ? QQExlong + 1 : 0
QQExshort := FastAtrRsiTL > RSIndex ? QQExshort + 1 : 0

//Conditions

qqeLong = QQExlong == 1 ? FastAtrRsiTL[1] - 50 : na
qqeShort = QQExshort == 1 ? FastAtrRsiTL[1] - 50 : na

// Plotting

plotshape(qqeLong, title="QQE long", text="Long", textcolor=color.white, style=shape.labelup, location=location.belowbar, color=color.green, transp=0, size=size.tiny)
plotshape(qqeShort, title="QQE short", text="Short", textcolor=color.white, style=shape.labeldown, location=location.abovebar, color=color.red, transp=0, size=size.tiny)

// Alerts

alertcondition(qqeLong, title="Long", message="Long")
alertcondition(qqeShort, title="Short", message="Short")