フラッグブレイクアウト戦略
作成日:
2024-02-22 16:41:04
最終変更日:
2024-02-22 16:41:04
コピー:
1
クリック数:
881
1
フォロー
1750
フォロワー
概要
旗型突破戦略は,旗型グラフを認識し,突破点に入場することでトレンドの始まりを捉えることを目的とした技術分析戦略である.この戦略は,平均真波動範囲 ((ATR) の指標の補助判断を使用して,明確な旗の後で旗の範囲を判断し,入場機会を出する.
戦略原則
この戦略は以下のステップで構成されています.
- 価格の革新とATRチャネルの突破に 取り組む必要がある.
- 旗の高さを決定する:旗の頂点と前期SMAの距離を測定する.
- 旗の範囲を決定する:旗の最低点は旗の高さの33%,旗の最小範囲である.
- 旗型を判定する:前3本のK線がすべて旗の範囲にあるかどうかを判定する.
- 入り口: 旗が表示されたら追加してください
- 出場:固定保有6K線後の清算.
旗と旗を判断する際には,策略はATR指標を巧みに使用して明らかな突破を判断し,旗の高さを33%以内で厳格に制限し,偽信号を過剰に避ける.また,3つの連続したK線が旗を構成する判断は,信頼性が高い.全体的に,この策略の規則は厳格に設計されており,トレンドの初期突破を捕捉する上で一定の優位性がある.
優位分析
この戦略の利点は以下の通りです.
- 旗型構造を用いてトレンドを判断するのは,技術分析の古典的な方法であり,成功率が高い.
- ATR指標と厳格な範囲制限により,大量の偽信号を回避し,入場精度を向上させる.
- 固定6K線出場は,利益の一部をロックし,トレンドの逆転のリスクを回避する.
- 戦略のルールは明確で実行しやすい. 簡単に習得し,従うことができます.
- 機会を探し出すことで 柔軟性が向上します
リスク分析
この戦略の主なリスクは以下の通りです.
- 旗型はトレンドを完全に判断できず,失敗するケースもあります.
- 試合は6K線が勝負しすぎ,早めに退場するかもしれない.
- 状況が不安定になると,偽の旗が浮かび上がります.
- 単一損失を効果的にコントロールできない
上記のリスクに対して,我々はストップ・ロスの戦略を設定したり,出場メカニズムを最適化したり,収益が一定比率に達したときに間に合うように利益を上げることができる.さらに,我々は他の指標と組み合わせてフィルタリングすることもでき,市場があまりにも揺れ動いているときに偽信号を生じないようにすることができる.
最適化の方向
この戦略は以下の方向から最適化できます.
- MACD,KDなどの指標を組み合わせて,震動状況下での偽信号を避ける.
- ATR倍数,出場周期などの市場カテゴリによるパラメータ化により,戦略がより適応的になります.
- 移動ストップを設定するか,利益の撤回を考慮するか,動的出場を想定する.
- 旗の高さを判断するより正確な特徴を探すために,機械学習の方法を試してみてください.
- 実際の勝率と損益率を評価し,ポジションの規模を動的に調整する.
要約する
全体的に見ると,技術形態判断のトレンドを利用した旗型突破戦略は,入場規則設計において厳格であり,大量の偽信号をフィルタリングできる比較的古典的な方法である.しかし,リスク管理と出場機構には,依然として最適化の余地があり,戦略をさまざまな市場において安定的に動作させることができる.充分に検証され,最適化されれば,この戦略は,量化取引システムの価値ある構成要素となる.
ストラテジーソースコード
/*backtest
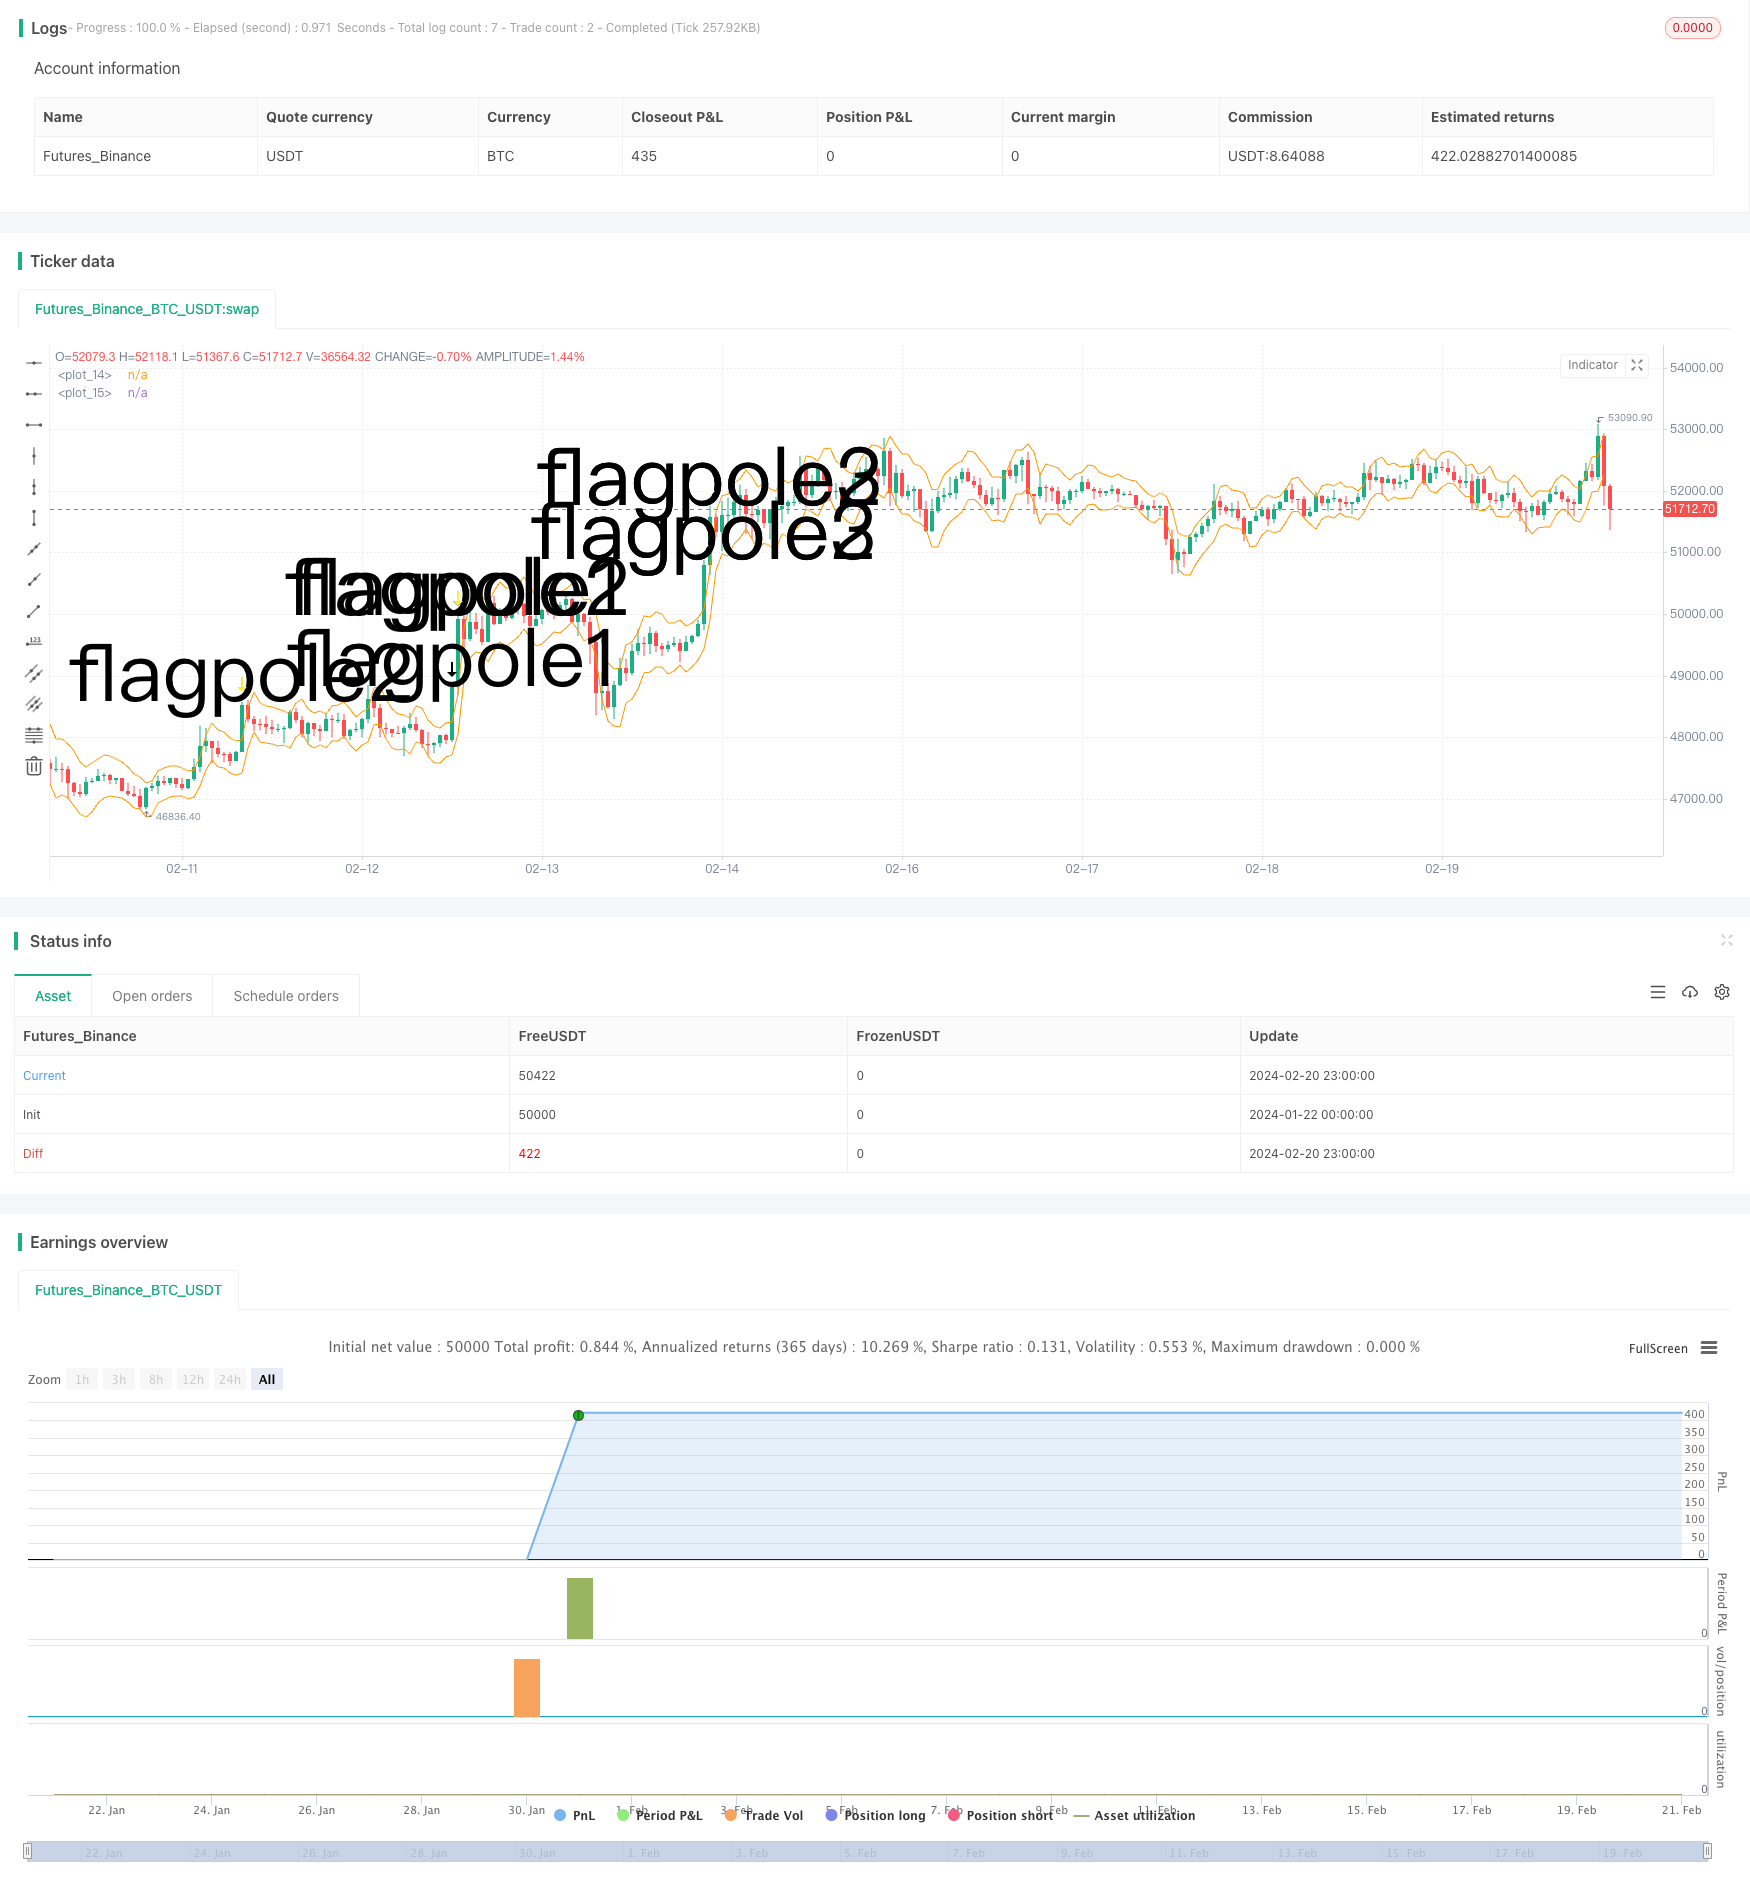
start: 2024-01-22 00:00:00
end: 2024-02-21 00:00:00
period: 1h
basePeriod: 15m
exchanges: [{"eid":"Futures_Binance","currency":"BTC_USDT"}]
*/
// © smith26
//This strategy enters on a bull flag and closes position 6 bars later. Average true range is used instead of a moving average.
//The reason for ATR instead of MA is because with volatile securities, the flagpole must stand up a noticable "distance" above the trading range---which you can't determine with a MA alone.
//This is broken up into multiple parts: Defining a flagpole, defining the pole height, and defining the flag, which will be constrained to the top third (33%) of the pole height to be considered a flag.
//@version=4
strategy("Bull Flag v1.00", overlay=true)
ATR = atr(10) //Average True Range over last 10 bars.
upperATR = ohlc4[1] + ATR[1] //Open + High + Low + Close divided by 4, + prior ATR. Just used here for visually plotting the ATR upper channel.
lowerATR = ohlc4[1] - ATR[1] //Open + High + Low + Close divided by 4, - prior ATR. Just used here for visually plotting the ATR lower channel.
//uncomment these two lines to see ATR channels
plot(upperATR, color=color.orange)
plot (lowerATR, color=color.orange)
//Current close higher than previous close, and current close minus current open is greater than 3 times the previous ATR. "3x ATR" is chosen because any less was not a noticeable distance above the trading range.
flagpole1 = close>close[1] and (close-open) > (ATR[1] * 3)
plotshape(flagpole1, text="flagpole1", style=shape.arrowdown, size=size.huge) //Plots an arrow for flagpole1 for QA testing
//Two consecutive close higer than their previous close, and current close minus PREVIOUS open is greater than 3 times the previous ATR.
flagpole2 = close>close[1] and close[1]>close[2] and (close-open[1]) > (ATR[1] * 3)
plotshape(flagpole2, text="flagpole2", style=shape.arrowdown, size=size.huge, color=color.yellow) //Plots an arrow for flagpole2 for QA testing
//Three consecutive close higer than their previous close, and current close minus open from 2 bars ago is greater than 3 times the previous ATR.
flagpole3 = close>close[1] and close[1]>close[2] and close[2]>close[3] and (close-open[2]) > (ATR[1] * 3)
plotshape(flagpole3, text="flagpole3", style=shape.arrowdown, size=size.huge, color=color.white) //Plots an arrow for flagpole3 for QA testing
//A flagpole can be any of the three definitions of flagpole.
flagpole = flagpole1 or flagpole2 or flagpole3
//This will return the number of bars since "flagpole" was true. Not being used, but could be useful.
//since_flagpole = barssince(flagpole)
after_pole_1 = flagpole[1] //This marks the bar directly after a flagpole.
//plotshape(after_pole_1, text="after_pole_1", style=shape.cross, size=size.large, color=color.white) //Plots a cross for after_pole_1 for QA testing
after_pole_2 = flagpole[2] //This marks the bar two bars after a flagpole.
after_pole_3 = flagpole[3] //This marks the bar three bars after a flagpole.
//This returns the price at the "top" of the flagpole (using close price) at the most recent occurence, 0.
pole_top = valuewhen(flagpole, close, 0)
//plot(pole_top, trackprice=true) //plots a horizontal line at the most recent pole_top
//Measures the distance between last pole top and the previous SMA.
pole_height = pole_top - sma(close, 10)[1]
//plot(pole_height)
//This marks 33% below the pole_top, which will be the lowest point a flag can be.
flag_bottom = pole_top - (.33 * pole_height)
//plot(flag_bottom)
//The first, second, and third bars after the pole are considered part of a flag when open and close are between the pole_top and flag_bottom
flag1 = after_pole_1 and (open >= flag_bottom) and (open <= pole_top) and (close >= flag_bottom) and (close <= pole_top)
//plotshape(flag1, text="flag1", style=shape.flag, size=size.large, color=color.teal)
flag2 = after_pole_2 and (open >= flag_bottom) and (open <= pole_top) and (close >= flag_bottom) and (close <= pole_top)
//plotshape(flag2, text="flag2", style=shape.flag, size=size.large, color=color.teal)
flag3 = after_pole_3 and (open >= flag_bottom) and (open <= pole_top) and (close >= flag_bottom) and (close <= pole_top)
//plotshape(flag3, text="flag3", style=shape.flag, size=size.large, color=color.teal)
//When all three bars after a flagpole are a flag, the criteria are met and we have a "bull_flag"
//Specifically, when current bar is flag3, previous bar is flag2, and 2 bars ago is flag1, we have a bull_flag.
bull_flag = flag3 and flag2[1] and flag1[2]
plotshape(bull_flag, text="bull_flag", style=shape.flag, size=size.large, color=color.white) //Plots a flag for bull_flag for QA testing
if (bull_flag)
strategy.entry("Long", strategy.long)
if barssince(bull_flag) == 6 //close 6 bars after entry.
strategy.close("Long")