衝撃突破戦略に基づく
作成日:
2024-02-22 17:15:01
最終変更日:
2024-02-22 17:15:01
コピー:
0
クリック数:
722
1
フォロー
1750
フォロワー
概要
震動突破戦略は,主流の暗号通貨の15分間の時間枠で使用される積極的な取引戦略である.それは,市場動向を識別し,潜在的突破点を発見し,ストップ・ロスを設定することによってリスクを効果的に管理するために技術指標を使用する.
戦略原則
この戦略は,2つの単純な移動平均 ((SMA50とSMA200) を使って市場トレンドの方向を決定する. SMA50がSMA200を突破すると看板信号であり,逆に下落信号である.
比較的強い指数 (RSI) は,超買い超売り状況を判断するために使用される. RSIが設定された超売り領域 (デフォルト40) よりも低くなると,超売り領域であり,潜在的買入信号とみなされる.
取引の論理は以下の通りです.
- RSIが40を下回り,SMA200以上の閉盘価格が買取条件となります.
- 長期ポジションへの入場
- スタート価格の5%に設定されます.
- SMA50を下回ってSMA200を突破し,RSIが50を超えると平仓して利益をロックする.
この戦略は簡単で,二重確認によって潜在的な突破点を探す. 損失の拡大を防ぐため,SMA指標の交差が退出信号として設定される.
優位分析
この戦略の利点は以下の通りです.
- 戦略はシンプルで実行しやすい.
- 偽突破をフィルタリングし,VALIDITYの突破を確実にする.
- RSIは,超売り区間の形成や買い取りのタイミングを特定します.
- ストップ・ロスを含め 積極的にリスクをコントロールする
- 退出のメカニズムとしてSMAの交差点
リスク分析
この戦略にはいくつかのリスクがあります.
- 市場が急激に波動すると,ストップは破られる可能性がある.
- SMAの期限を正しく設定していないと,トレンドが失われる可能性があります.
- 長期間の空置が利益に影響する.
改善するには,以下の方法を使います.
- ストップ・ローズの動的調整
- SMAパラメータの最適化
- 持仓のタイミングを判断する他の要因を考慮する.
要約する
全体として,震動突破戦略は,シンプルで実用的なショートライン戦略である.操作の簡素性,リスクの管理など,暗号通貨市場にあまり慣れていないトレーダーに適している.さらなる最適化により,戦略は,より多くの市場環境で安定した収益を維持することができる.
ストラテジーソースコード
/*backtest
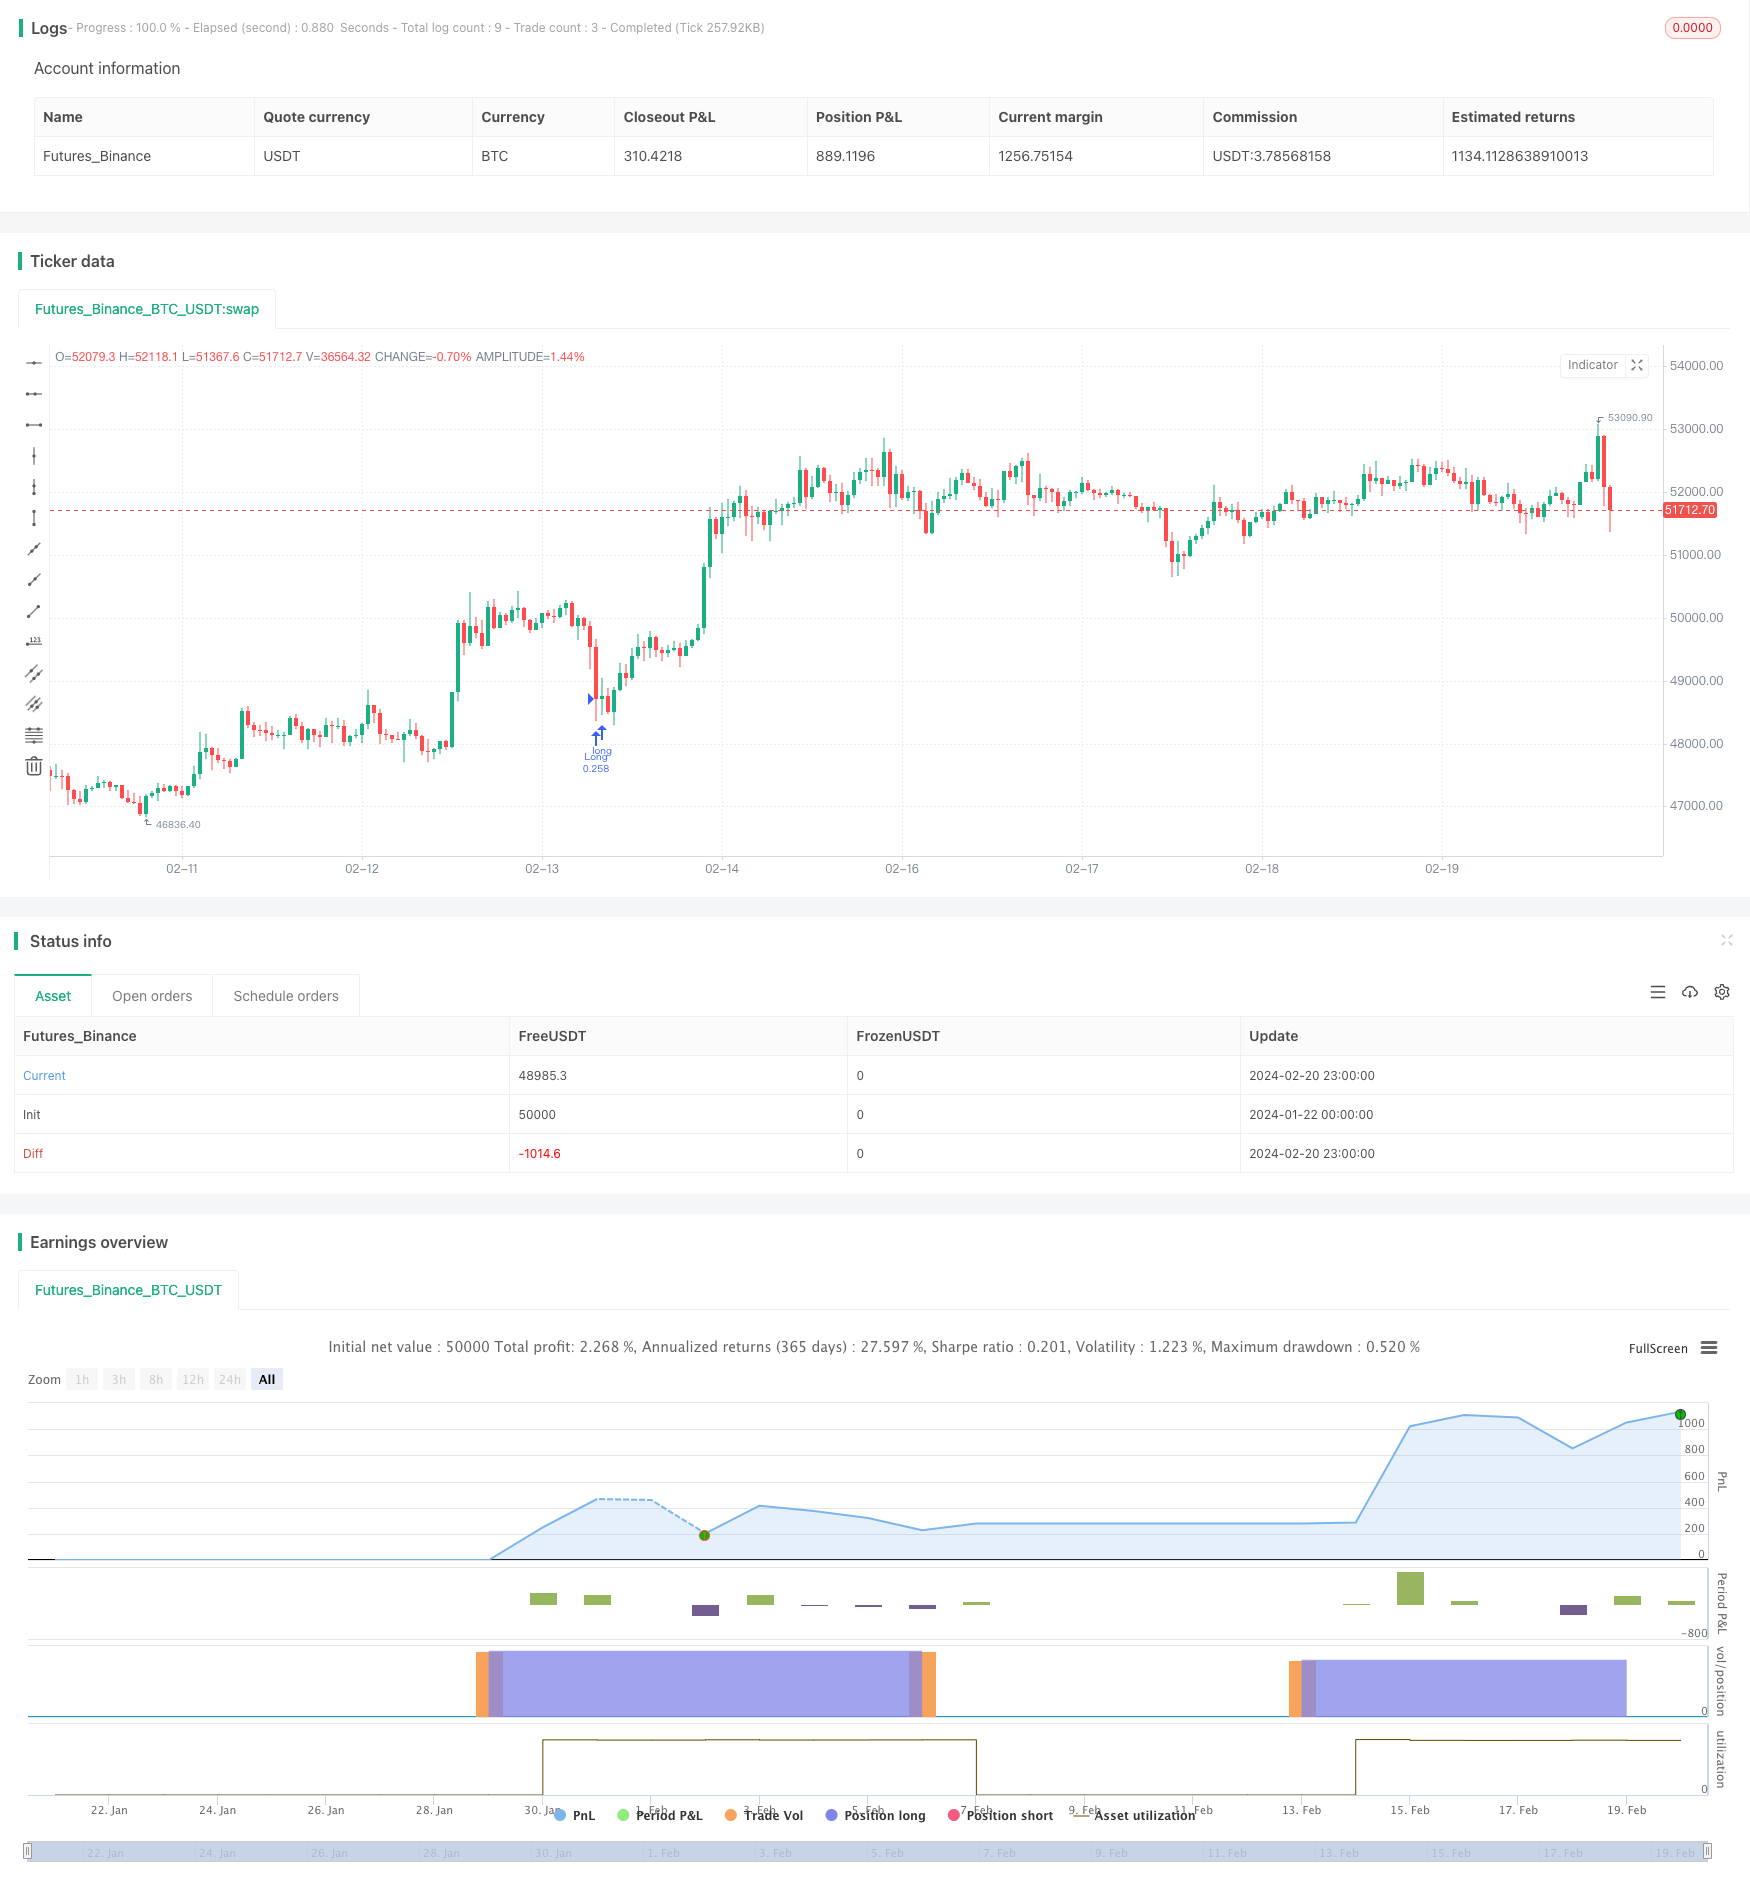
start: 2024-01-22 00:00:00
end: 2024-02-21 00:00:00
period: 1h
basePeriod: 15m
exchanges: [{"eid":"Futures_Binance","currency":"BTC_USDT"}]
*/
// This source code is subject to the terms of the Mozilla Public License 2.0 at https://mozilla.org/MPL/2.0/
// © Wielkieef
//@version=5
strategy("Crypto Sniper [15min]", shorttitle="ST Strategy", overlay=true, pyramiding=1, initial_capital=10000, default_qty_type=strategy.percent_of_equity, default_qty_value=25, calc_on_order_fills=false, slippage=0, commission_type=strategy.commission.percent, commission_value=0.03)
sma50Length = input(90, title=" SMA50 Length", group="Simple Moving Average")
sma200Length = input(170, title=" SMA200 Length", group="Simple Moving Average")
rsiLength = input(14, title=" RSI Length", group="Relative Strenght Index")
overSoldLevel = input(40, title=" Oversold Level", group="Relative Strenght Index")
sl = input.float(5.0, '% Stop Loss', step=0.1)
rsi = ta.rsi(close, rsiLength)
sma50 = ta.sma(close, sma50Length)
sma200 = ta.sma(close, sma200Length)
longCondition = rsi < overSoldLevel and close > sma200
if (longCondition)
strategy.entry("Long", strategy.long)
stopLossPrice = strategy.position_avg_price * (1 - sl / 100)
strategy.exit("Stop Loss", stop=stopLossPrice)
if (ta.crossunder(sma200, sma50) and rsi >= 50)
strategy.close("Long")
Bar_color = ta.crossunder(sma200, sma50) and rsi >= 50 ? color.orange : rsi < overSoldLevel ? color.maroon : strategy.position_avg_price != 1 ? color.green : color.gray
barcolor(color=Bar_color)
//by wielkieef