EMA RSI トレンドフォローとモメンタム戦略
作成日:
2024-03-29 16:30:42
最終変更日:
2024-03-29 16:30:42
コピー:
2
クリック数:
733
1
フォロー
1750
フォロワー
概要
Bybit EMA RSI トレンドトラッキングとモーション戦略は,指数移動平均 ((EMA) と相対的に強い指数 ((RSI) を組み合わせた量化取引戦略である.この戦略は,二つの異なる周期のEMAを使用して市場トレンドを判断し,同時にRSI指標を使用してトレンドの有効性を確認する.急速なEMAの上を通過すると,遅いEMAとRSIが特定の下限を下回ると,戦略は多信号を生成する.逆に,急速なEMAの下を通過すると,遅いEMAとRSIが特定の上限を下回ると,戦略は空信号を生成する.この戦略は,Bybitアカウント等によって異なる手数料比率を設定し,内蔵の止損停止機能を使用して,リスクを効果的に制御する.
戦略原則
- 周期90と300の,高速EMAと遅いEMAを計算する.
- RSIは周期5で計算されます.
- 速速EMAの上を通過すると遅速EMAで,RSIが45を下回ると,多做信号が生成され,速速EMA下を通過すると遅速EMAで,RSIが85以上になると空做信号が生成される.
- ビビットアカウントのレベルによって異なる手数料の割合が設定され,VIP 0の0.075%からVIP 4の0.035%まで様々である。
- 取引開始価格に手数料が含まれている.
- 設定したストップ・ストップ・損失パーセント ((5%と3%) によってストップ・価格とストップ・損失価格を計算する.
- スタート価格,ストップライン,ストップロスの線をグラフに描く.
- 取引シグナルに基づいてポジション開設操作を行う.
戦略的優位性
- トレンドトラッキングと動態指標の組み合わせにより,市場動向をよりよく捉えることができます.
- 内蔵の止止損機能により,リスクを効果的に制御できます.
- Bybitアカウントのレベルによって異なる手数料の割合を設定し,異なるユーザーの取引条件に適応します.
- ポジション開設価格,ストップライン,ストップロスの線をグラフに描き,直観的な取引シグナル確認を提供します.
戦略リスク
- EMAとRSIのパラメータの選択は,すべての市場環境に適用されない可能性があり,実際の状況に応じて最適化する必要があります.
- 波動的な市場では,この戦略は頻繁に取引シグナルを発生させ,高額な取引コストを引き起こす可能性があります.
- ストップ・ストップ・損失の設定は,保守的または過激すぎる可能性があり,個人のリスクの好みに合わせて調整する必要がある.
戦略最適化の方向性
- EMAとRSIのパラメータは,異なる市場環境に対応するために最適化されます. 最適なパラメータの組み合わせは,反射とパラメータのスキャンで探すことができます.
- 取引信号の正確性を高めるために,ブリン帯,MACDなどの他の技術指標を導入する.
- 利潤を保護し,リスクを制御するために,移動式ストップまたは動的なストップ方法などのストップストップの設定を最適化します.
- 市場波動性や取引量などの要因を考慮し,取引信号をフィルタリングし,頻繁な取引によるコストを削減する.
要約する
Bybit EMA RSI トレンド追跡と動力の戦略は,トレンド追跡と動力の指標を組み合わせた量化取引戦略であり,EMAとRSIの組み合わせにより,市場動向をよりよく捉えることができます.この戦略は,ストップ・ロスの機能とBybitアカウントのレベルに応じて手数料を設定する機能を内蔵し,リスクを効果的に制御し,ユーザーの異なる取引条件に適応できます.しかし,この戦略には,パラメータ最適化,他の技術指標の導入,ストップ・ロスの設定の最適化などの最適化の余地があります.
ストラテジーソースコード
/*backtest
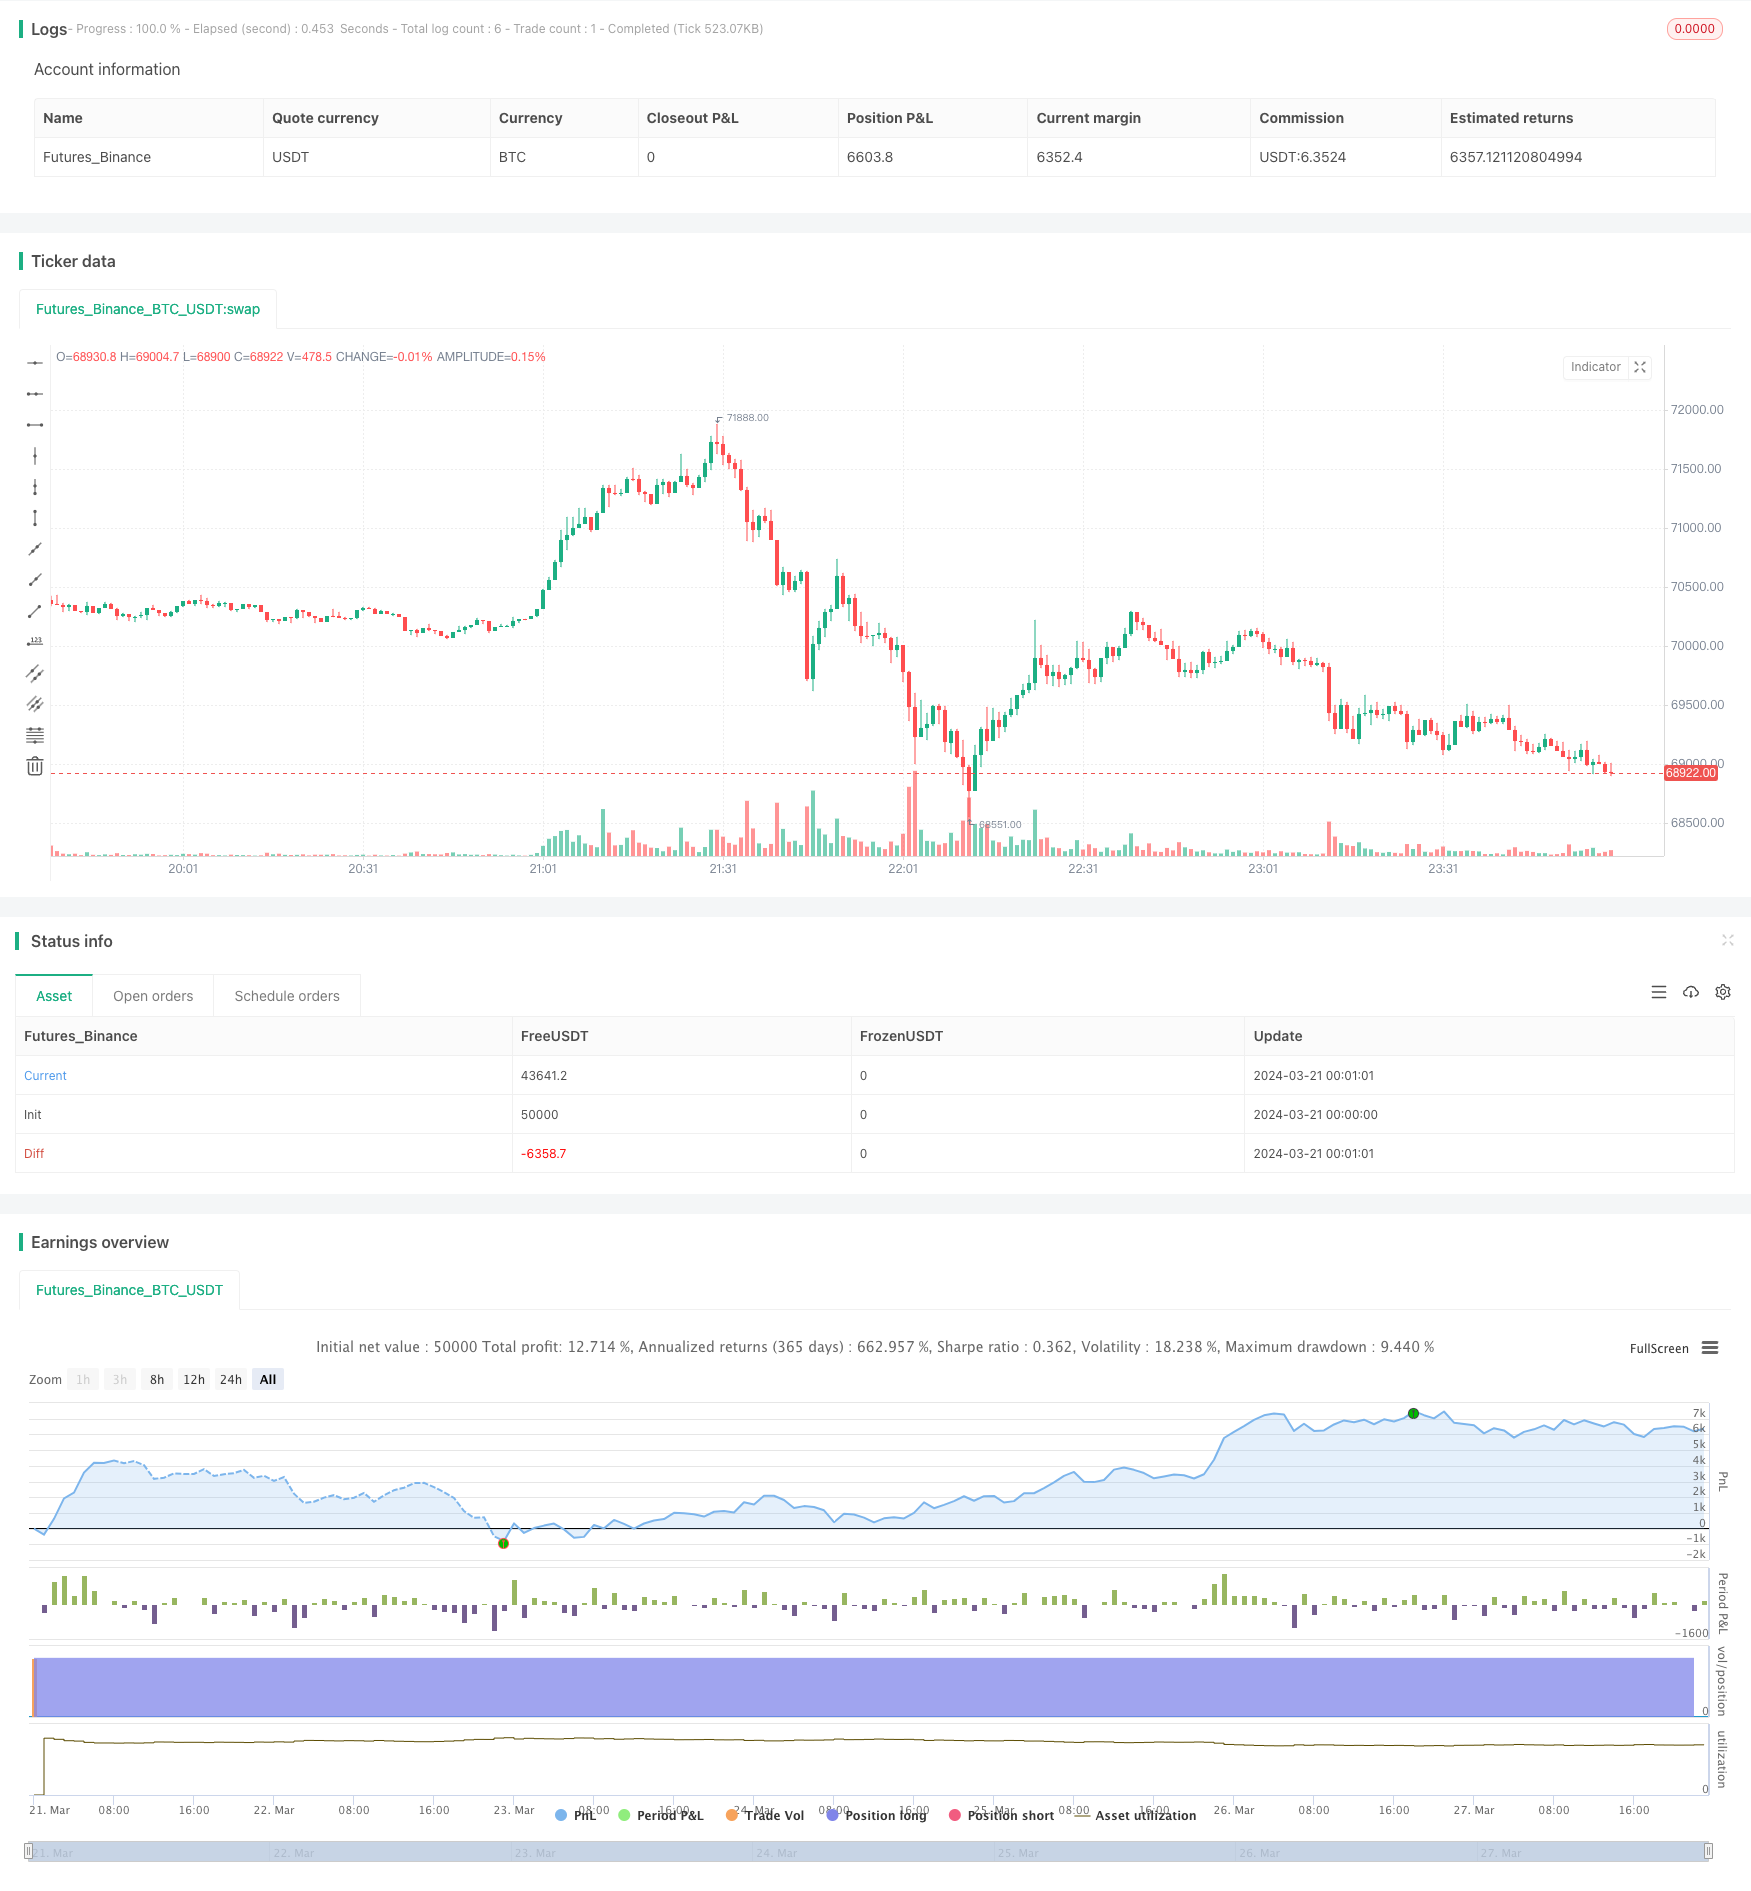
start: 2024-03-21 00:00:00
end: 2024-03-28 00:00:00
period: 1m
basePeriod: 1m
exchanges: [{"eid":"Futures_Binance","currency":"BTC_USDT"}]
*/
// @BryanAaron
//@version=5
strategy("Bybit EMA RSI Strategy", overlay=true)
// Input parameters
fastLength = input(90, title="Fast EMA Length")
slowLength = input(300, title="Slow EMA Length")
rsiLength = input(5, title="RSI Length")
rsiUpperThreshold = input(85, title="RSI Upper Threshold")
rsiLowerThreshold = input(45, title="RSI Lower Threshold")
takeProfitPerc = input(5, title="Take Profit %")
stopLossPerc = input(3, title="Stop Loss %")
bybitAccountLevel = input.string("VIP 0", title="Bybit Account Level", options=["VIP 0", "VIP 1", "VIP 2", "VIP 3", "VIP 4"])
// Calculate moving averages
fastMA = ta.ema(close, fastLength)
slowMA = ta.ema(close, slowLength)
// Calculate RSI
rsi = ta.rsi(close, rsiLength)
// Trading conditions
longCondition = (fastMA > slowMA) and (rsi < rsiLowerThreshold)
shortCondition = (fastMA < slowMA) and (rsi > rsiUpperThreshold)
// Set commission based on Bybit account level
commissionPerc = switch bybitAccountLevel
"VIP 0" => 0.075
"VIP 1" => 0.065
"VIP 2" => 0.055
"VIP 3" => 0.045
"VIP 4" => 0.035
=> 0.075
// Calculate entry prices with commission
var float longEntryPrice = na
var float shortEntryPrice = na
longEntryPriceWithCommission = close * (1 + commissionPerc / 100)
shortEntryPriceWithCommission = close * (1 - commissionPerc / 100)
// Calculate take profit and stop loss prices
takeProfitPrice(entryPrice) => entryPrice * (1 + takeProfitPerc / 100)
stopLossPrice(entryPrice) => entryPrice * (1 - stopLossPerc / 100)
// Plot entry prices
plotchar(longCondition, title="Long Entry Price", char="LE", location=location.belowbar, color=color.green)
plotchar(shortCondition, title="Short Entry Price", char="SE", location=location.abovebar, color=color.red)
// Draw position on the chart
longColor = color.green
shortColor = color.red
profitColor = color.new(color.green, 80)
lossColor = color.new(color.red, 80)
plotshape(longCondition and strategy.position_size > 0, title="Long Position", text="Long", location=location.belowbar, style=shape.labelup, size=size.small, color=longColor, textcolor=color.white)
plotshape(shortCondition and strategy.position_size < 0, title="Short Position", text="Short", location=location.abovebar, style=shape.labeldown, size=size.small, color=shortColor, textcolor=color.white)
if (strategy.position_size > 0)
line.new(bar_index, longEntryPrice, bar_index + 1, longEntryPrice, color=longColor, width=2)
longProfitLine = line.new(bar_index, takeProfitPrice(longEntryPrice), bar_index + 1, takeProfitPrice(longEntryPrice), color=profitColor, width=1)
longLossLine = line.new(bar_index, stopLossPrice(longEntryPrice), bar_index + 1, stopLossPrice(longEntryPrice), color=lossColor, width=1)
else if (strategy.position_size < 0)
line.new(bar_index, shortEntryPrice, bar_index + 1, shortEntryPrice, color=shortColor, width=2)
shortProfitLine = line.new(bar_index, stopLossPrice(shortEntryPrice), bar_index + 1, stopLossPrice(shortEntryPrice), color=profitColor, width=1)
shortLossLine = line.new(bar_index, takeProfitPrice(shortEntryPrice), bar_index + 1, takeProfitPrice(shortEntryPrice), color=lossColor, width=1)
// Entry
if (longCondition)
strategy.entry("Long", strategy.long)
longEntryPrice := longEntryPriceWithCommission
else if (shortCondition)
strategy.entry("Short", strategy.short)
shortEntryPrice := shortEntryPriceWithCommission