알고리즘 RSI 범위 돌파 전략


생성 날짜: 2023-10-17 17:14:09 마지막으로 수정됨: 2023-10-17 17:14:09
복사: 0 클릭수: 759
avatar of ChaoZhang ChaoZhang
1
집중하다
1617
수행원

알고리즘 RSI 범위 돌파 전략

개요

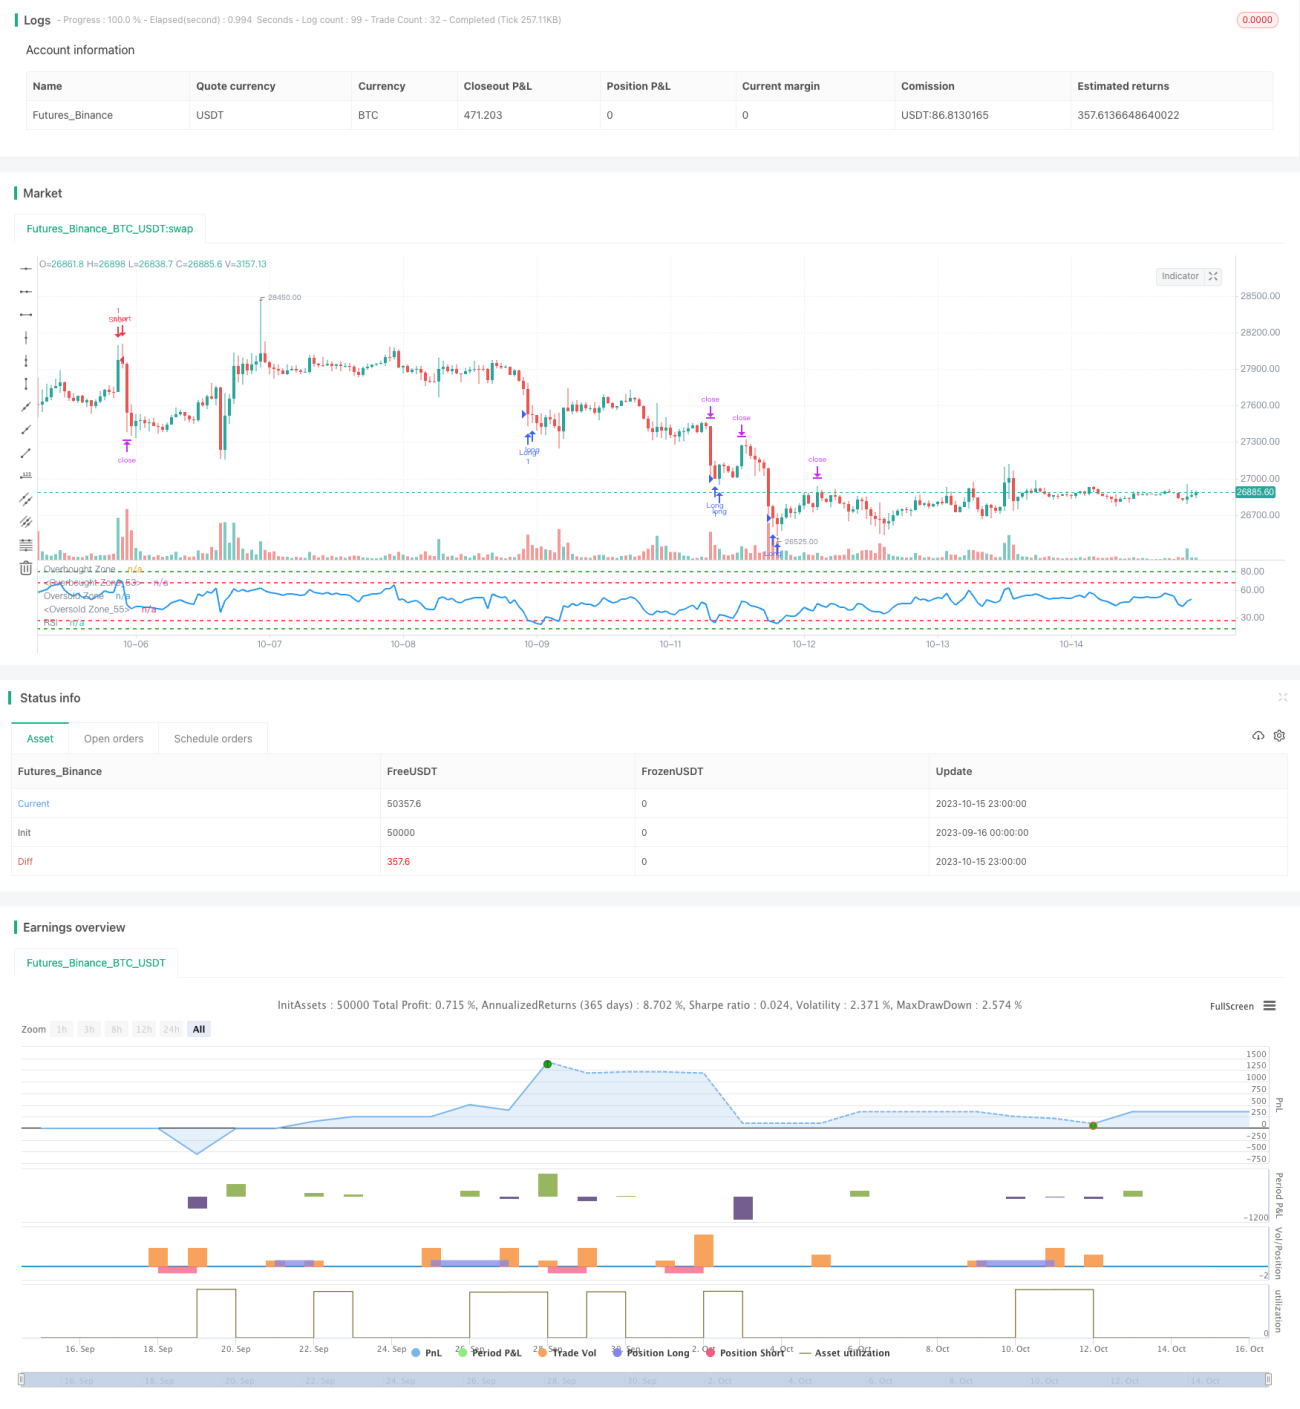
이 전략은 RSI 지표의 다양한 범위에 대한 돌파구를 모니터링하여 낮은 가격으로 구매하고 높은 가격으로 판매하는 것을 목표로합니다. RSI가 낮은 범위에있는 때 구매하고 RSI가 높은 범위에있는 때 판매하여 과대 구매 과대 판매 현상이 발생할 때 역전 작업을 수행합니다.

전략 원칙

  1. RSI의 길이는 14주기입니다.

  2. 구매 신호의 RSI 범위를 설정합니다:

    • RSI <= 27
    • RSI <= 18
  3. 판매 신호의 RSI 범위를 설정합니다.

    • 1단계: RSI >= 68
    • RSI >= 80
  4. RSI가 매매 범위에 들어갔을 때, 더 많은 매매를 합니다.

    • RSI가 1 (~27) 이내로 들어가면 1번 더 하십시요
    • 만약 RSI가 2 (~18 이하) 에 들어간다면, 1번 더 하십시요.
  5. RSI가 매매 범위에 들어서면 상장합니다.

    • RSI가 1 (~ 68) 이내로 들어간다면 1번의 공백을 가집니다.
    • 만약 RSI가 2~80이 넘으면, 1번 더 마이너스를 합니다.
  6. 매번 포지션 개설할 때마다 2,500점의 고정 스톱, 5,000점의 스톱

  7. RSI가 시그널 범위를 벗어나면 해당 포지션을 평행합니다.

우위 분석

  1. 이중 간격 설정은 전략이 과매매 현상을 더 명확하게 판단하고 역전 기회를 놓치지 않도록합니다.

  2. 고정 스톱 스톱 손실 점수 설정을 사용하여 너무 많이 추격하지 않습니다.

  3. RSI는 다른 지표들에 비해 우위를 점하는 비교적 성숙한 과매매 판단 지표입니다.

  4. 이 전략의 매개 변수는 합리적으로 설정되면 트렌드 역점을 효과적으로 포착하여 초과 수익을 얻을 수 있습니다.

위험 분석

  1. RSI 지표가 실패한 시장이 발생할 수 있으며, 이로 인해 시스템이 계속 적자를 줄일 수 있습니다.

  2. 고정 스톱 스톱 손실 점수 설정은 시장의 변동과 일치하지 않을 수 있으며 수익을 얻지 못하거나 조기 중단 될 수 있습니다.

  3. 불합리한 간격 설정은 놓친 거래 기회 또는 빈번한 거래 손실을 초래할 수 있습니다.

  4. 이 전략은 변수 최적화에 의존하며, 테스트 사이클과 슬라이드 포인트 제어에 주의를 기울여야 한다.

최적화 방향

  1. 다양한 길이의 주기의 RSI 지표 효과를 테스트 할 수 있습니다.

  2. 구매/판매 간격을 최적화하여 다양한 품종의 특성에 맞게 만들 수 있는 수치

  3. 동적 정지 손해 막는 방법을 연구하여 더 효율적이고 합리적인 정지를 할 수 있습니다.

  4. 시스템 안정성을 높이기 위해 다른 지표와 결합된 포트폴리오 거래를 고려할 수 있습니다.

  5. 자동적으로 간격 변수를 최적화하여 전략을 더 거칠게하는 기계 학습 방법을 탐색할 수 있습니다.

요약하다

이 전략은 RSI 지표의 오버 구매 오버 판매 판단 원칙에 기반하여 설계되었다. 쌍 구매 오버 판매 구간을 설정하여 RSI 지표의 효용을 발휘하고, 일정 수준의 안정성을 유지하면서, 시장의 오버 구매 오버 판매 현상을 효과적으로 포착 할 수 있습니다. 그러나 이 전략은 또한 일정 수준의 변수 의존성이 있으며, 다양한 품종에 대한 최적화 테스트가 필요합니다.

전략 소스 코드
/*backtest
start: 2023-09-16 00:00:00
end: 2023-10-16 00:00:00
period: 1h
basePeriod: 15m
exchanges: [{"eid":"Futures_Binance","currency":"BTC_USDT"}]
*/

// This source code is subject to the terms of the Mozilla Public License 2.0 at https://mozilla.org/MPL/2.0/
// © Rawadabdo

// Ramy's Algorithm

//@version=5
strategy("BTC/USD - RSI", overlay=false, initial_capital = 5000)

// User input
length = input(title = "Length", defval=14, tooltip="RSI period")

first_buy_level = input(title = "Buy Level 1", defval=27, tooltip="Level where 1st buy triggers")
second_buy_level = input(title = "Buy Level 2", defval=18, tooltip="Level where 2nd buy triggers")

first_sell_level = input(title = "Sell Level 1", defval=68, tooltip="Level where 1st sell triggers")
second_sell_level = input(title = "Sell Level 2", defval=80, tooltip="Level where 2nd sell triggers")

takeProfit= input(title="target Pips", defval=2500, tooltip="Fixed pip stop loss distance")
stopLoss = input(title="Stop Pips", defval=5000, tooltip="Fixed pip stop loss distance")

lot = input(title = "Lot Size", defval = 1, tooltip="Trading Lot size")

// Get RSI
vrsi = ta.rsi(close, length)

// Entry Conditions
long1 = (vrsi <= first_buy_level and vrsi>second_buy_level)
long2 = (vrsi <= second_buy_level)

short1= (vrsi >= first_sell_level and vrsi<second_sell_level)
short2= (vrsi >= second_sell_level)


// Entry Orders
// Buy Orders
if (long1 and strategy.position_size == 0)
    strategy.entry("Long", strategy.long, qty=lot, comment="Buy")
    if (long2 and  strategy.position_size == 0)
        strategy.entry("Long", strategy.long, qty=lot, comment="Buy")

// Short Orders
if (short1 and strategy.position_size == 0)
    strategy.entry("Short", strategy.short,qty=lot, comment="Sell")
    if (short2 and strategy.position_size == 0)
        strategy.entry("Short", strategy.short,qty=lot, comment="Sell")
    
// Exit our trade if our stop loss or take profit is hit
strategy.exit(id="Long Exit", from_entry="Long",qty = lot, profit=takeProfit, loss=stopLoss)
strategy.exit(id="Short Exit", from_entry="Short", qty = lot, profit=takeProfit, loss=stopLoss)

// plot data to the chart
hline(first_sell_level, "Overbought Zone", color=color.red, linestyle=hline.style_dashed, linewidth = 2)
hline(second_sell_level, "Overbought Zone", color=color.green, linestyle=hline.style_dashed, linewidth = 2)
hline(first_buy_level, "Oversold Zone", color=color.red, linestyle=hline.style_dashed, linewidth = 2)
hline(second_buy_level, "Oversold Zone", color=color.green, linestyle=hline.style_dashed, linewidth = 2)
plot (vrsi, title = "RSI", color = color.blue, linewidth=2)