
이 전략은 브레이크 전략과 트렌드 트래킹 스톱 전략의 장점을 결합하여 긴 선 그래프에서 지지 저항의 브레이크 신호를 포착하는 동시에 이동 평균을 사용하여 스톱 트래킹을 수행하여 긴 선 트렌드의 방향에서 수익을 창출하는 동시에 위험을 제어하는 것을 목표로합니다.
전략은 먼저 여러 개의 다른 변수의 이동 평균을 계산하여 추세를 판단하고, 지지 저항과 손실 추적으로 사용합니다.
다음으로 지정된 주기 내의 최고점과 최저점을 찾아내어 진입하는 지원 저항 영역으로 사용한다. 가격이 이러한 지원 저항을 뚫을 때 신호가 발생한다.
전략은 파격 최고점을 위해 다중 신호를 구매하고, 파격 최저점을 위해 하위 신호를 판매한다.
진입 후, 브레이크 최저점의 최저점을 스톱로스로 포지션을 보유한다.
포지션이 이윤 상태에 들어간 후, 스톱로스는 이동 평균을 추적하는 것으로 전환된다. 가격이 이동 평균을 넘어갈 때, 스톱로스는 이 루트 K 선의 가장 낮은 지점으로 설정된다.
이런 식으로 수익을 고정시킬 수 있고, 동시에 트렌드를 추적할 수 있는 충분한 공간을 제공합니다.
전략은 평균 실제 변동이 포함되면서 적절한 범위에서만 파격 구매를 보장하고 과도한 확장을 피합니다.
브레이크 전략과 트렌드 추적 전략을 결합한 스톱 손실 전략의 이중 장점.
그리고, 이 경우, 이 상품은 상위권에 속해있으며, 상위권에서는 상위권에 속해있으며,
스톱 손실 전략은 포지션을 보호하고 포지션에 충분한 공간을 제공합니다.
변동율 필터를 추가하여 과도한 상승을 방지하는 불리한 돌파구를 추가합니다.
자동화 거래, 부분 시간 계정
다양한 주기 평균선에서 동작할 수 있다.
유연하게 조정할 수 있는 손해 차단 추적 방법
해킹 전략은 가짜 해킹의 위험이 있다. 해킹 확인은 적절히 완화될 수 있다.
이 신호는 돌파구 신호를 생성하기 위해 충분한 파동이 필요하며, 돌파구 신호는 돌파구 신호를 생성하기 위해 충분한 파동이 필요하며, 돌파구 신호는 돌파구 신호를 생성하기 위해 충분한 파동이 필요하며, 돌파구 신호는 돌파구 신호를 생성하기 위해 충분한 파동이 필요하다.
일부 돌파구들은 너무 짧아서 잡을 수 없습니다. 더 많은 기회를 찾기 위해 시간軸을 낮출 수 있습니다.
추적 스로퍼는 진동상태에서 너무 자주 스로퍼할 수 있다. 스로퍼 거리를 적절히 완화할 수 있다.
변동률 필터링은 일부 기회를 놓칠 수 있다. 필터링 매개 변수를 낮출 수 있다.
다양한 평행선 변수 조합을 테스트하여 최적의 변수를 찾습니다.
통로, K선 형태 등과 같은 다양한 돌파 확인 메커니즘을 테스트한다.
다른 손해 추적 방법을 시도하여 최적의 손해 추적 방법을 찾아보세요.
자금 관리 전략의 최적화, 포지톤 스코어 등
통계 기술 지표 필터링을 추가하여 필터링 정확도를 향상시킵니다.
이 전략의 효과를 다른 품종으로 테스트하는 것.
기계학습 알고리즘을 추가하여 전략 효과를 향상시킵니다.
이 전략은 브레이크 아이디어와 트렌드 추적 스톱 아이디어를 통합하여 긴 선을 올바르게 판단하는 경우 수익 공간을 최적화 할 수 있습니다. 가장 중요한 것은 최적의 파라미터 조합을 찾고, 좋은 자금 관리 전략과 함께 긴 길이의 기회를 잡는 동시에 위험을 통제 할 수 있습니다. 이 전략은 더 나은 최적화를 통해 더 신뢰할 수있는 긴 길이의 트렌드 전략이 될 전망입니다.
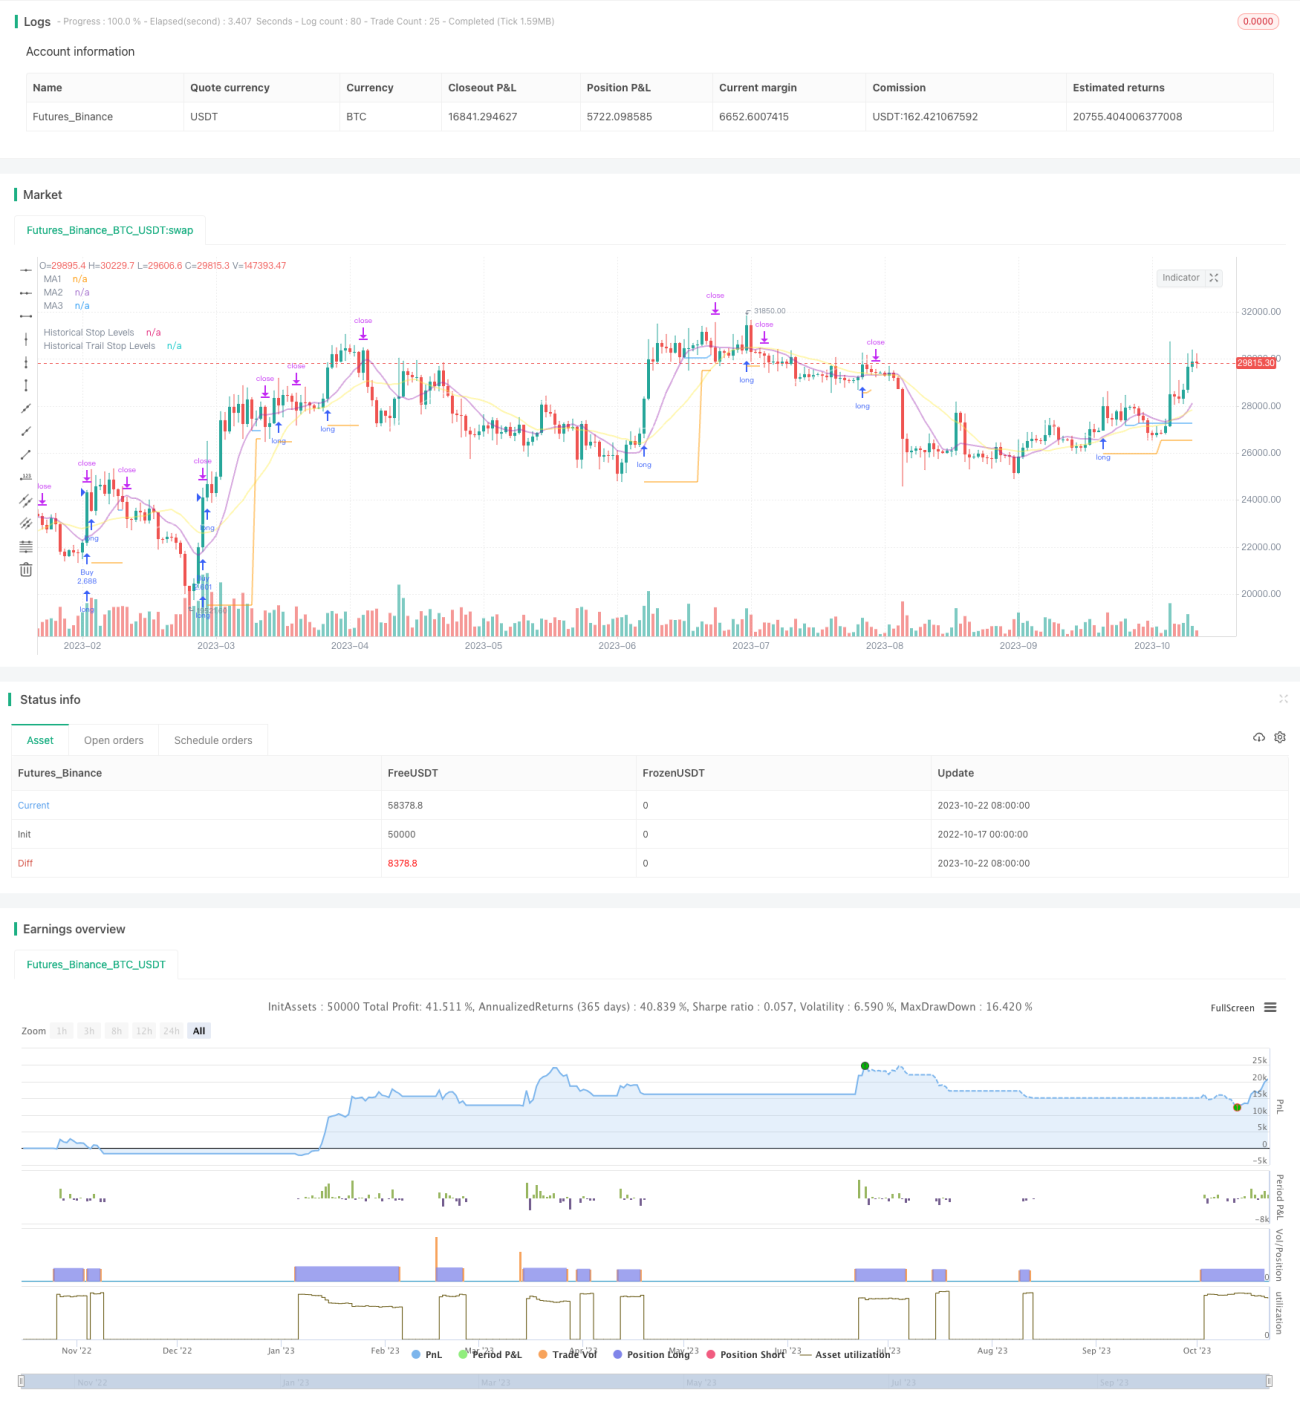
/*backtest
start: 2022-10-17 00:00:00
end: 2023-10-23 00:00:00
period: 1d
basePeriod: 1h
exchanges: [{"eid":"Futures_Binance","currency":"BTC_USDT"}]
*/
// This source code is subject to the terms of the Mozilla Public License 2.0 at https://mozilla.org/MPL/2.0/
// © millerrh
// The intent of this strategy is to buy breakouts with a tight stop on smaller timeframes in the direction of the longer term trend.
// Then use a trailing stop of a close below either the 10 MA or 20 MA (user choice) on that larger timeframe as the position
// moves in your favor (i.e. whenever position price rises above the MA).
// Option of using daily ADR as a measure of finding contracting ranges and ensuring a decent risk/reward.
// (If the difference between the breakout point and your stop level is below a certain % of ATR, it could possibly find those consolidating periods.)
// V2 - updates code of original Qullamaggie Breakout to optimize and debug it a bit - the goal is to remove some of the whipsaw and poor win rate of the
// original by incorporating some of what I learned in the Breakout Trend Follower script.
//@version=4
strategy("Qullamaggie Breakout V2", overlay=true, initial_capital=100000, currency='USD', calc_on_every_tick = true,
default_qty_type=strategy.percent_of_equity, default_qty_value=100, commission_type=strategy.commission.percent, commission_value=0.1)
// === BACKTEST RANGE ===
Start = input(defval = timestamp("01 Jan 2019 06:00 +0000"), title = "Backtest Start Date", type = input.time, group = "backtest window and pivot history")
Finish = input(defval = timestamp("01 Jan 2100 00:00 +0000"), title = "Backtest End Date", type = input.time, group = "backtest window and pivot history")
// Inputs
showPivotPoints = input(title = "Show Historical Pivot Points?", type = input.bool, defval = false, group = "backtest window and pivot history",
tooltip = "Toggle this on to see the historical pivot points that were used. Change the Lookback Periods to adjust the frequency of these points.")
htf = input(defval="D", title="Timeframe of Moving Averages", type=input.resolution, group = "moving averages",
tooltip = "Allows you to set a different time frame for the moving averages and your trailing stop.
The default behavior is to identify good tightening setups on a larger timeframe
(like daily) and enter the trade on a breakout occuring on a smaller timeframe, using the moving averages of the larger timeframe to trail your stop.")
maType = input(defval="SMA", options=["EMA", "SMA"], title = "Moving Average Type", group = "moving averages")
ma1Length = input(defval = 10, title = "1st Moving Average Length", minval = 1, group = "moving averages")
ma2Length = input(defval = 20, title = "2nd Moving Average Length", minval = 1, group = "moving averages")
ma3Length = input(defval = 50, title = "3rd Moving Average Length", minval = 1, group = "moving averages")
useMaFilter = input(title = "Use 3rd Moving Average for Filtering?", type = input.bool, defval = true, group = "moving averages",
tooltip = "Signals will be ignored when price is under this slowest moving average. The intent is to keep you out of bear periods and only
buying when price is showing strength or trading with the longer term trend.")
trailMaInput = input(defval="1st Moving Average", options=["1st Moving Average", "2nd Moving Average"], title = "Trailing Stop", group = "stops",
tooltip = "Initial stops after entry follow the range lows. Once in profit, the trade gets more wiggle room and
stops will be trailed when price breaches this moving average.")
trailMaTF = input(defval="Same as Moving Averages", options=["Same as Moving Averages", "Same as Chart"], title = "Trailing Stop Timeframe", group = "stops",
tooltip = "Once price breaches the trail stop moving average, the stop will be raised to the low of that candle that breached. You can choose to use the
chart timeframe's candles breaching or use the same timeframe the moving averages use. (i.e. if daily, you wait for the daily bar to close before setting
your new stop level.)")
currentColorS = input(color.new(color.orange,50), title = "Current Range S/R Colors: Support", type = input.color, group = "stops", inline = "lineColor")
currentColorR = input(color.new(color.blue,50), title = " Resistance", type = input.color, group = "stops", inline = "lineColor")
// Pivot lookback
lbHigh = 3
lbLow = 3
// MA Calculations (can likely move this to a tuple for a single security call!!)
ma(maType, src, length) =>
maType == "EMA" ? ema(src, length) : sma(src, length) //Ternary Operator (if maType equals EMA, then do ema calc, else do sma calc)
ma1 = security(syminfo.tickerid, htf, ma(maType, close, ma1Length))
ma2 = security(syminfo.tickerid, htf, ma(maType, close, ma2Length))
ma3 = security(syminfo.tickerid, htf, ma(maType, close, ma3Length))
plot(ma1, color=color.new(color.purple, 60), style=plot.style_line, title="MA1", linewidth=2)
plot(ma2, color=color.new(color.yellow, 60), style=plot.style_line, title="MA2", linewidth=2)
plot(ma3, color=color.new(color.white, 60), style=plot.style_line, title="MA3", linewidth=2)
// === USE ADR FOR FILTERING ===
// The idea here is that you want to buy in a consolodating range for best risk/reward. So here you can compare the current distance between
// support/resistance vs. the ADR and make sure you aren't buying at a point that is too extended.
useAdrFilter = input(title = "Use ADR for Filtering?", type = input.bool, defval = false, group = "adr filtering",
tooltip = "Signals will be ignored if the distance between support and resistance is larger than a user-defined percentage of ADR (or monthly volatility
in the stock screener). This allows the user to ensure they are not buying something that is too extended and instead focus on names that are consolidating more.")
adrPerc = input(defval = 120, title = "% of ADR Value", minval = 1, group = "adr filtering")
tableLocation = input(defval="Bottom", options=["Top", "Bottom"], title = "ADR Table Visibility", group = "adr filtering",
tooltip = "Place ADR table on the top of the pane, the bottom of the pane, or off.")
adrValue = security(syminfo.tickerid, "D", sma((high-low)/abs(low) * 100, 21)) // Monthly Volatility in Stock Screener (also ADR)
adrCompare = (adrPerc * adrValue) / 100
// === PLOT SWING HIGH/LOW AND MOST RECENT LOW TO USE AS STOP LOSS EXIT POINT ===
ph = pivothigh(high, lbHigh, lbHigh)
pl = pivotlow(low, lbLow, lbLow)
highLevel = valuewhen(ph, high[lbHigh], 0)
lowLevel = valuewhen(pl, low[lbLow], 0)
barsSinceHigh = barssince(ph) + lbHigh
barsSinceLow = barssince(pl) + lbLow
timeSinceHigh = time[barsSinceHigh]
timeSinceLow = time[barsSinceLow]
//Removes color when there is a change to ensure only the levels are shown (i.e. no diagonal lines connecting the levels)
pvthis = fixnan(ph)
pvtlos = fixnan(pl)
hipc = change(pvthis) != 0 ? na : color.new(color.maroon, 0)
lopc = change(pvtlos) != 0 ? na : color.new(color.green, 0)
// Display Pivot lines
plot(showPivotPoints ? pvthis : na, color=hipc, linewidth=1, offset=-lbHigh, title="Top Levels")
plot(showPivotPoints ? pvthis : na, color=hipc, linewidth=1, offset=0, title="Top Levels 2")
plot(showPivotPoints ? pvtlos : na, color=lopc, linewidth=1, offset=-lbLow, title="Bottom Levels")
plot(showPivotPoints ? pvtlos : na, color=lopc, linewidth=1, offset=0, title="Bottom Levels 2")
// BUY AND SELL CONDITIONS
buyLevel = valuewhen(ph, high[lbHigh], 0) //Buy level at Swing High
// Conditions for entry
stopLevel = float(na) // Define stop level here as "na" so that I can reference it in the ADR calculation before the stopLevel is actually defined.
buyConditions = (useMaFilter ? buyLevel > ma3 : true) and
(useAdrFilter ? (buyLevel - stopLevel[1]) < adrCompare : true)
buySignal = crossover(high, buyLevel) and buyConditions
// Trailing stop points - when price punctures the moving average, move stop to the low of that candle - Define as function/tuple to only use one security call
trailMa = trailMaInput == "1st Moving Average" ? ma1 : ma2
f_getCross() =>
maCrossEvent = crossunder(low, trailMa)
maCross = valuewhen(maCrossEvent, low, 0)
maCrossLevel = fixnan(maCross)
maCrossPc = change(maCrossLevel) != 0 ? na : color.new(color.blue, 0) //Removes color when there is a change to ensure only the levels are shown (i.e. no diagonal lines connecting the levels)
[maCrossEvent, maCross, maCrossLevel, maCrossPc]
crossTF = trailMaTF == "Same as Moving Averages" ? htf : ""
[maCrossEvent, maCross, maCrossLevel, maCrossPc] = security(syminfo.tickerid, crossTF, f_getCross())
plot(showPivotPoints ? maCrossLevel : na, color = maCrossPc, linewidth=1, offset=0, title="Ma Stop Levels")
// == STOP AND PRICE LEVELS ==
inPosition = strategy.position_size > 0
buyLevel := inPosition ? buyLevel[1] : buyLevel
stopDefine = valuewhen(pl, low[lbLow], 0) //Stop Level at Swing Low
inProfit = strategy.position_avg_price <= stopDefine[1]
// stopLevel := inPosition ? stopLevel[1] : stopDefine // Set stop loss based on swing low and leave it there
stopLevel := inPosition and not inProfit ? stopDefine : inPosition and inProfit ? stopLevel[1] : stopDefine // Trail stop loss until in profit
trailStopLevel = float(na)
// trying to figure out a better way for waiting on the trail stop - it can trigger if above the stopLevel even if the MA hadn't been breached since opening the trade
notInPosition = strategy.position_size == 0
inPositionBars = barssince(notInPosition)
maCrossBars = barssince(maCrossEvent)
trailCross = inPositionBars > maCrossBars
// trailCross = trailMa > stopLevel
trailStopLevel := inPosition and trailCross ? maCrossLevel : na
plot(inPosition ? stopLevel : na, style=plot.style_linebr, color=color.new(color.orange, 50), linewidth = 2, title = "Historical Stop Levels", trackprice=false)
plot(inPosition ? trailStopLevel : na, style=plot.style_linebr, color=color.new(color.blue, 50), linewidth = 2, title = "Historical Trail Stop Levels", trackprice=false)
// == PLOT SUPPORT/RESISTANCE LINES FOR CURRENT CHART TIMEFRAME ==
// Use a function to define the lines
// f_line(x1, y1, y2, _color) =>
// var line id = na
// line.delete(id)
// id := line.new(x1, y1, time, y2, xloc.bar_time, extend.right, _color)
// highLine = f_line(timeSinceHigh, highLevel, highLevel, currentColorR)
// lowLine = f_line(timeSinceLow, lowLevel, lowLevel, currentColorS)
// == ADR TABLE ==
tablePos = tableLocation == "Top" ? position.top_right : position.bottom_right
var table adrTable = table.new(tablePos, 2, 1, border_width = 3)
lightTransp = 90
avgTransp = 80
heavyTransp = 70
posColor = color.rgb(38, 166, 154)
negColor = color.rgb(240, 83, 80)
volColor = color.new(#999999, 0)
f_fillCellVol(_table, _column, _row, _value) =>
_transp = abs(_value) > 7 ? heavyTransp : abs(_value) > 4 ? avgTransp : lightTransp
_cellText = tostring(_value, "0.00") + "%\n" + "ADR"
table.cell(_table, _column, _row, _cellText, bgcolor = color.new(volColor, _transp), text_color = volColor, width = 6)
srDistance = (highLevel - lowLevel)/highLevel * 100
f_fillCellCalc(_table, _column, _row, _value) =>
_c_color = _value >= adrCompare ? negColor : posColor
_transp = _value >= adrCompare*0.8 and _value <= adrCompare*1.2 ? lightTransp :
_value >= adrCompare*0.5 and _value < adrCompare*0.8 ? avgTransp :
_value < adrCompare*0.5 ? heavyTransp :
_value > adrCompare*1.2 and _value <= adrCompare*1.5 ? avgTransp :
_value > adrCompare*1.5 ? heavyTransp : na
_cellText = tostring(_value, "0.00") + "%\n" + "Range"
table.cell(_table, _column, _row, _cellText, bgcolor = color.new(_c_color, _transp), text_color = _c_color, width = 6)
if barstate.islast
f_fillCellVol(adrTable, 0, 0, adrValue)
f_fillCellCalc(adrTable, 1, 0, srDistance)
// f_fillCellVol(adrTable, 0, 0, inPositionBars)
// f_fillCellCalc(adrTable, 1, 0, maCrossBars)
// == STRATEGY ENTRY AND EXIT ==
strategy.entry("Buy", strategy.long, stop = buyLevel, when = buyConditions)
stop = stopLevel > trailStopLevel ? stopLevel : close[1] > trailStopLevel and close[1] > trailMa ? trailStopLevel : stopLevel
strategy.exit("Sell", from_entry = "Buy", stop=stop)