
[trans]
개요
쌍방파 필터 전략은 브로드가 2010년 ?? 주식과 상품 ?? 저널에 발표한 기사를 바탕으로 한 전략이다. 이 전략은 브로드파 필터의 수치를 계산하여 주식 가격의 변동을 식별하고 거래 신호를 준다. 파 필터 수치가 부진보다 높을 때 과시하고, 부진보다 낮을 때 과시하면 트렌드를 따르게 한다.
전략 원칙
이 전략은 다음과 같은 몇 가지 단계로 구성됩니다.
-
초기화 매개 변수: 브로드밴드 길이 포함
Length변동수Delta빈 구역의 절댓값SellZone여러 구역의 임계값을 보세요BuyZone기다리다. -
브로드밴드 필터 계산
BP: 일련의 삼각형 함수를 통해 파장 필터의 값을 계산한다. -
포지션 방향을 판단하기 위해:
BP더 높은SellZone이 값이 0보다 낮으면BuyZone더 많은 일을 해야 합니다. 그렇지 않으면 현재 지위를 유지해야 합니다. -
출력 신호: 포지션 지향에 따라 출력하는 더 많은 공백 신호.
-
K선 색을 그리기: 신호 결과에 따라 K선 색을 설정한다.
-
파장 필터 곡선을 그리기 <unk>
이 전략은 브로드밴드 필터를 통해 시장의 단기 변동성을 캡처하고, 변동성이 일정 규모에 도달했을 때 거래 신호를 생성하여 시장 추세에 따라 거래한다.
우위 분석
-
브로드밴드 필터를 기반으로 시장의 변동에 더 민감하게 반응하여 단기 트렌드를 포착할 수 있다.
-
매개 변수를 최적화하여 변동에 대한 민감도를 조정하여 다른 시장 환경에 적응 할 수 있습니다.
-
전략의 논리는 간단하고 명확하며, 구현을 이해하기 쉽습니다.
-
최적의 변수 조합을 찾기 위해 편리하게 변수를 조정할 수 있습니다.
-
시각화된 파동 필터 곡선, 직관적으로 시장의 변동을 나타냅니다.
위험 분석
-
브로드밴드 필터는 오버 최적화 된 후 너무 민감하여 잘못된 신호를 생성 할 수 있습니다.
-
변동의 끝을 알 수 없으므로 손실이 커질 수 있습니다.
-
거래 빈도가 너무 높아서 거래 비용과 점유율이 높아질 수 있습니다.
-
엑스포는 엑스포를 통해 신호를 전달할 수 있습니다.
-
다른 품종과 시장 환경에 맞게 적절한 변수를 조정해야 합니다.
-
단편적 손실을 통제하기 위해 스톱로스를 설정하는 것이 고려될 수 있다.
-
적절히 출전 시간을 연장하거나 필터 조건을 사용하여 잘못된 신호를 줄일 수 있다.
최적화 방향
-
매개 변수를 최적화하여 최적의 매개 변수 조합을 찾습니다. 최적화 목표는 승률, 손실률, 샤프 비율 등의 지표를 고려할 수 있습니다.
-
평균선, 가격 패턴과 같은 필터링 조건을 추가하여 트렌드하지 않은 지역에서 거래하는 것을 피하십시오.
-
여러 지표가 결합된 변수 조합을 고려하여 농킷 트레이딩을 수행하여 일방적인 위험을 분산하십시오.
-
단독 손실을 제어하기 위해 스톱 로직을 추가한다. 동적 스톱 또는 추적 스톱을 고려할 수 있다.
-
모바일 스톱을 추가하고, 수익을 잠금한다. 또한 트렌드 단계에 따라 다른 스톱 위치를 설정할 수 있다.
-
진입 신호를 최적화하여 흔들리는 시장에서 잘못된 신호를 피한다. 포지션 기간을 연장하거나 가격 돌파구를 진입 신호로 설정하는 것을 고려할 수 있다.
-
다양한 품종의 가격 차이를 이용한 다중 품종의 경매 시스템으로 확장했다.
-
재검토, 최적화, 최적의 품종 선택, 재배치 전략
요약하다
쌍방파 필터링 전략은 폭파 필터를 계산하여 가격 변동의 강도를 판단하고, 변동이 경계에 도달했을 때 거래 신호를 생성하며, 시장의 단기 트렌드에 대한 민감도가 높으며, 간단하게 구현되는 장점이 있습니다. 그러나 이 전략은 파라미터와 거래 빈도에 민감하며, 잘못된 신호를 줄이고 위험을 제어하기 위해 적절히 최적화해야합니다.
||
Overview
The Dual Bandpass Filter strategy is adapted from the strategy published by Broder in Stocks & Commodities magazine in 2010. It generates trading signals by calculating the value of Broder's bandpass filter to identify price fluctuations in stocks. It goes short when the bandpass filter value is higher than the threshold, and goes long when it is lower, to follow the trend.
Strategy Logic
The key steps of this strategy are:
-
Initialize parameters including bandpass length
Length, fluctuation coefficientDelta, short zone thresholdSellZone, and long zone thresholdBuyZone. -
Calculate the Broder bandpass filter
BPusing a series of trigonometric functions. -
Determine position direction: go short if
BPis aboveSellZone; go long if belowBuyZone; otherwise, maintain current position. -
Output signals: generate long/short signals based on position direction.
-
Set bar colors based on signal results.
-
Plot the bandpass filter curve.
This strategy captures short-term fluctuations using the Broder bandpass filter, and generates trading signals when the fluctuations reach certain magnitude to follow the trend.
Advantage Analysis
-
More sensitive to market fluctuations based on the Broder bandpass filter, which can catch short-term trends.
-
The sensitivity can be adjusted through parameter tuning to adapt to different market environments.
-
Simple and clear strategy logic, easy to understand and implement.
-
Parameters can be easily optimized to find the best combination.
-
Visual bandpass filter curve intuitively shows market fluctuations.
Risk Analysis
-
Overly optimized bandpass filter may become too sensitive and generate false signals.
-
Unable to determine fluctuation end points, may lead to expanding losses.
-
High trading frequency may increase costs and slippage risks.
-
Vulnerable to black swan events that trigger false signals.
-
Parameters need adjusting for different products and markets.
-
Consider setting stop loss to control loss per trade.
-
Extend exit time or add filters to reduce false signals.
Optimization Directions
-
Optimize parameters to find the best combination, evaluating win rate, profit ratio, Sharpe ratio etc.
-
Add filters like moving average cross, price patterns to avoid trading in non-trending areas.
-
Consider combining parameters across multiple instruments for basket trading to diversify risks.
-
Add stop loss logic to control loss per trade, like dynamic stops or trailing stops.
-
Add profit taking like moving profit stops to lock in gains. Different levels can be set for different trend stages.
-
Optimize entry signals to avoid false signals in ranging markets. Consider longer holding periods or breakout signals.
-
Expand to a cross-asset arbitrage system utilizing price differentials for hedging.
-
Backtest optimization for best asset selection and rebalancing strategies.
Summary
The Dual Bandpass Filter strategy judges price fluctuations using Broder's bandpass filter and generates signals when the fluctuations reach thresholds, with the advantage of high sensitivity to short-term trends and easy implementation. However, it is sensitive to parameters and trading frequency, requiring optimization to reduce false signals and manage risks. Overall, it provides an option for catching short-term trends, but overfitting should be avoided, and other technical tools can be combined for trading.
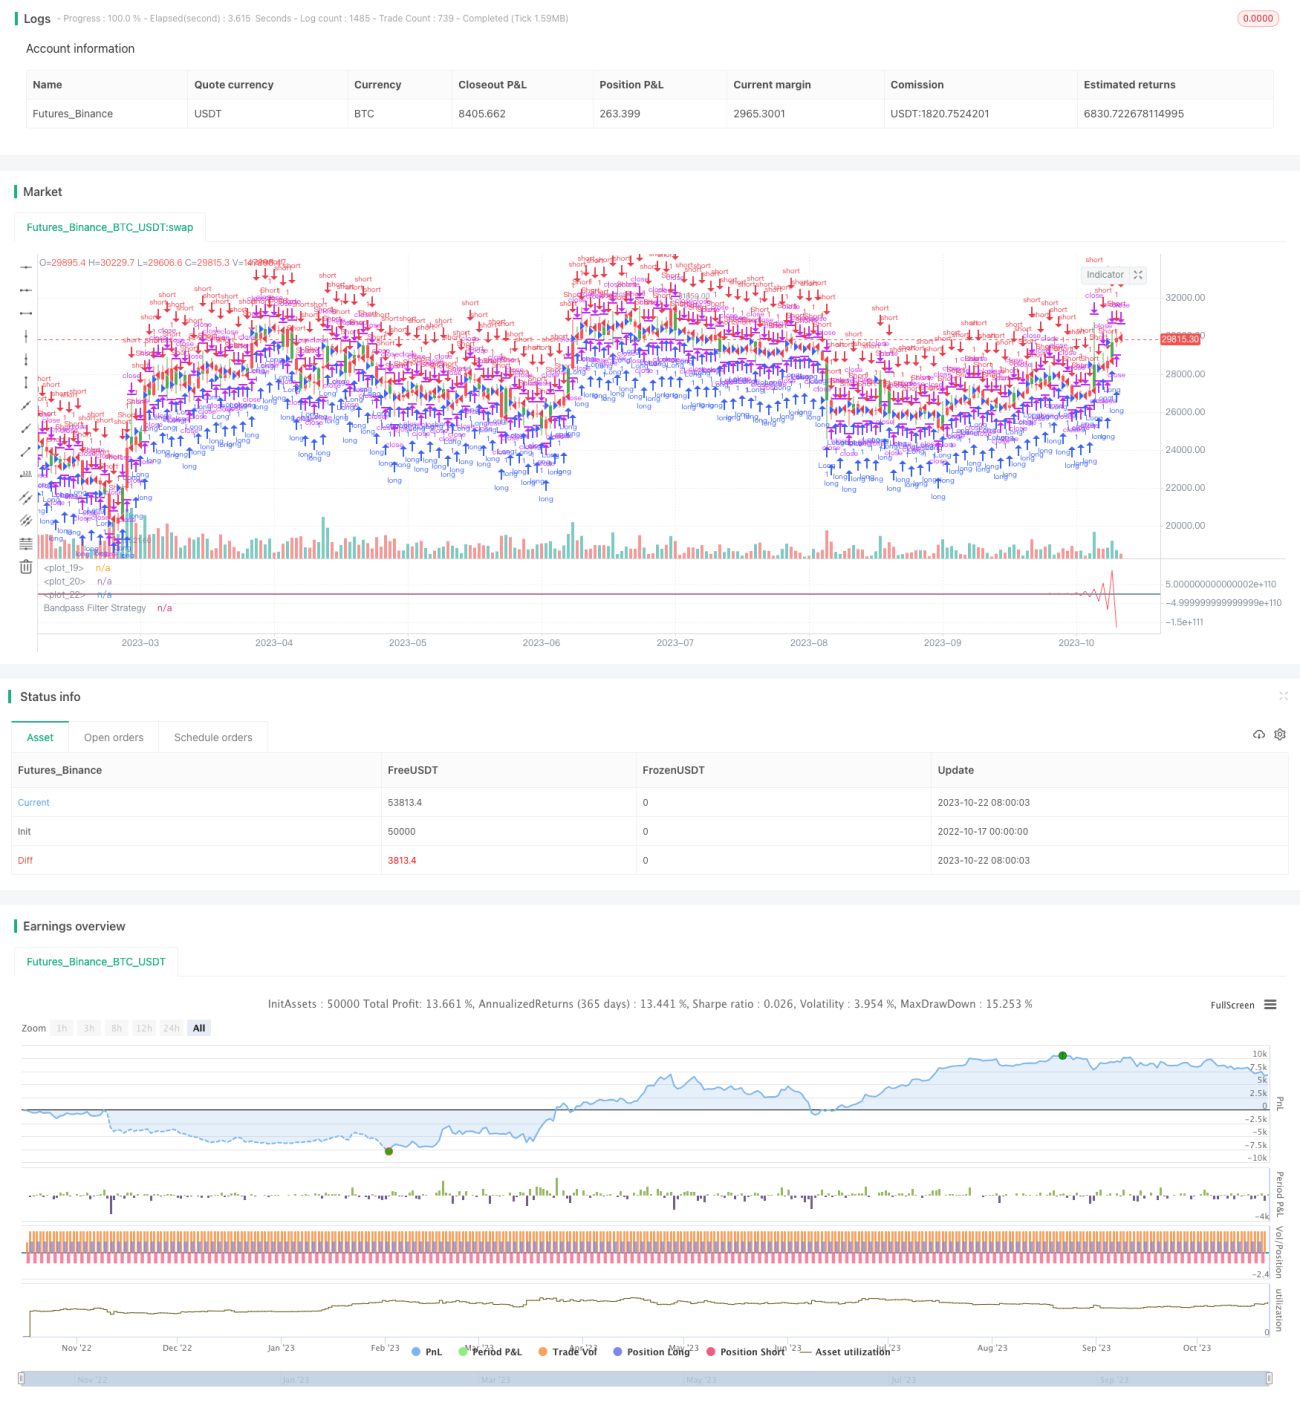
/*backtest
start: 2022-10-17 00:00:00
end: 2023-10-23 00:00:00
period: 1d
basePeriod: 1h
exchanges: [{"eid":"Futures_Binance","currency":"BTC_USDT"}]
*/

//@version=2
////////////////////////////////////////////////////////////
//  Copyright by HPotter v1.0 18/09/2018
// The related article is copyrighted material from- 1