CCI 전략에 따른 모멘텀

개요
이 전략은 상품 통로 지수 ((CCI) 지표에 기반하여 과매매 시 더 많이 하고 과매매 시 더 적게 하기 위한 것이다. 또한 선택적으로 지수 이동 평균 ((EMA) 필터를 사용하여 트렌드 방향에서만 거래하는 것을 제어한다. 이 전략은 또한 고정된 퍼센트 또는 평균 실제 범위 ((ATR) 에 기반한 손실을 중지하는 방법을 제공한다.
전략 원칙
-
CCI를 사용하여 시장의 흐름을 판단합니다.
-
CCI는 현재 가격을 일정 기간 동안의 평균 가격과 비교하여 동력을 측정합니다.
-
CCI above 150은 과매매, below -100은 과매매
-
-
선택적으로 EMA 필터
-
가격이 EMA보다 높을 때만 더 많이 하고, 가격이 EMA보다 낮을 때만 더 많이 한다.
-
EMA를 사용하여 트렌드 방향을 판단하여 반트렌드 거래를 피하십시오.
-
-
두 가지의 손해 방지 방법을 제공합니다.
-
고정 비율에 기반한 스톱 로드: 입시 가격의 고정 비율을 사용하여 스톱 로드를 설정합니다.
-
ATR 기반의 스톱로스: ATR의 배수를 사용하여 스톱로스를 설정하고, 리스크/수익률에 따라 스톱로스를 계산합니다.
-
-
입학 조건
-
CCI가 100선을 통과했을 때 더 많은 일을 했습니다.
-
CCI 아래 150선을 통과할 때 공백
-
만약 EMA가 활성화되어 있다면, EMA보다 가격이 높을 때만 더 많이 하고, EMA보다 가격이 낮을 때만 더 많이 하고
-
-
출전 조건
-
가격 제지 하락
-
CCI가 다시 초고매 지역으로 진입하면서 하락
-
-
지도
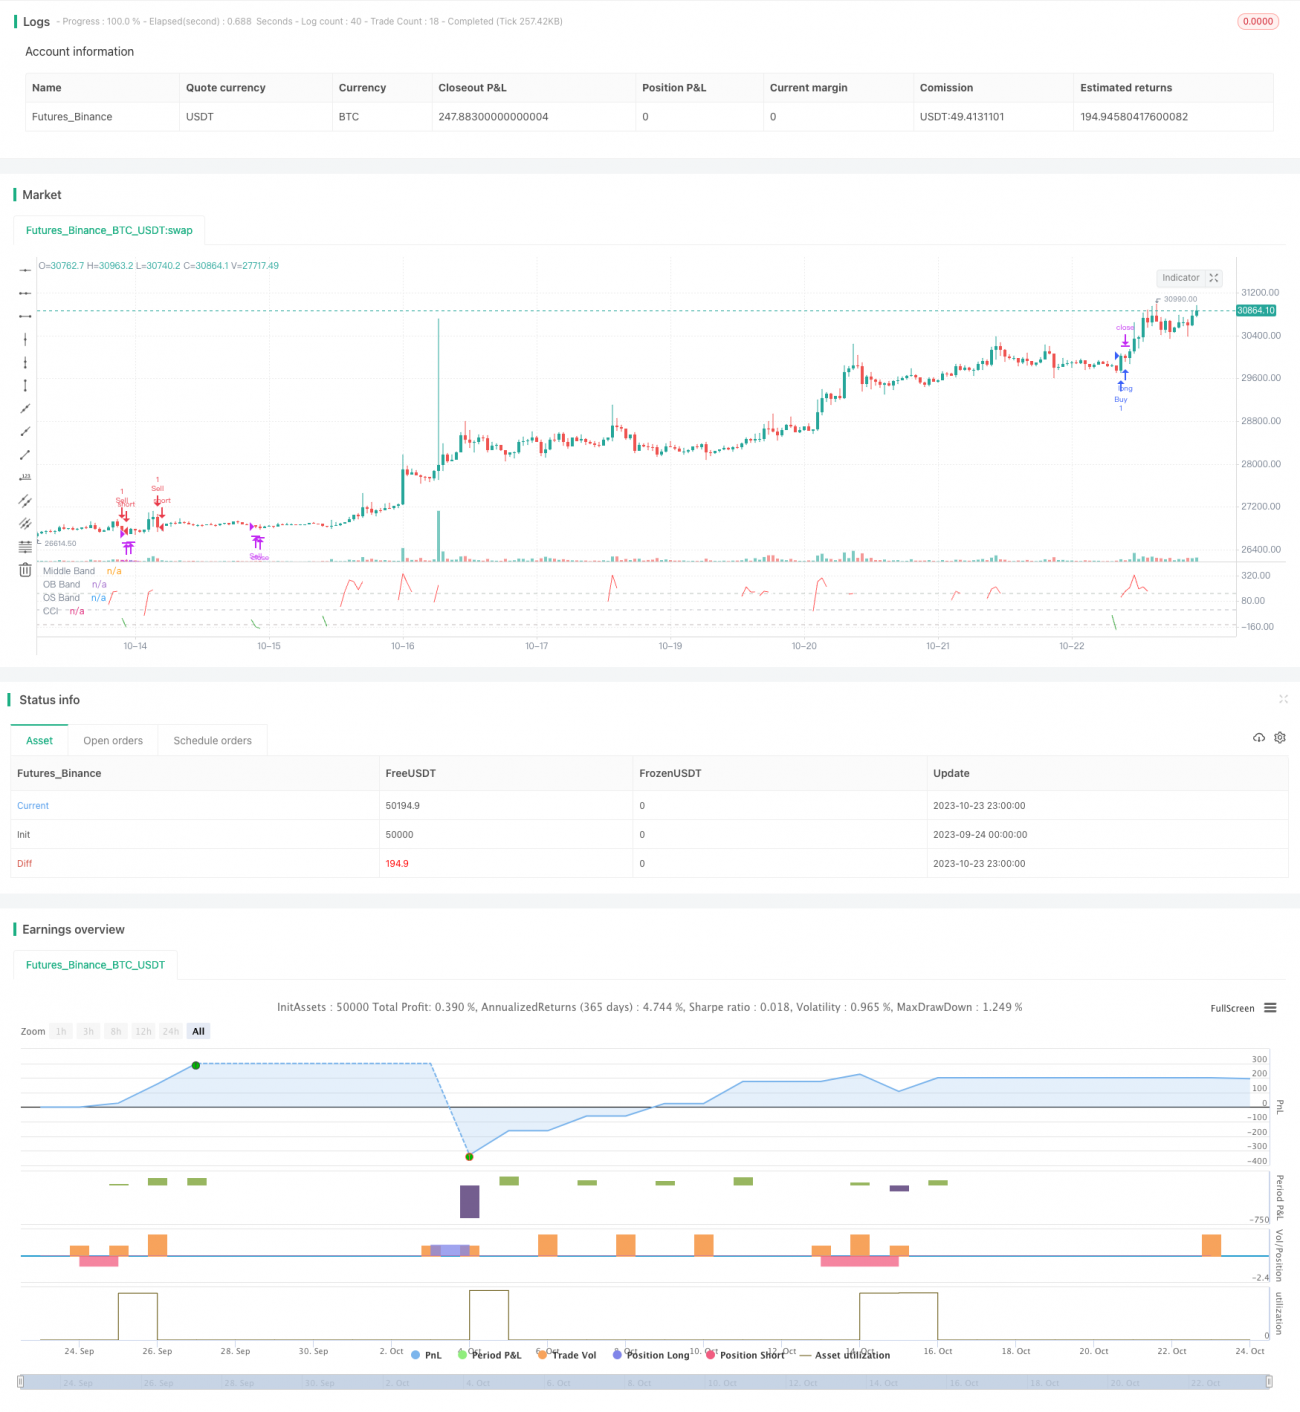
- 지도 CCI 지표, 지역 색상
우위 분석
-
CCI를 사용하여 과매매를 판단하는 것은 CCI 지표의 고전적인 용어입니다.
-
선택적 EMA는 트렌드 방향으로 거래하는 것을 보장하고 반전을 방지합니다.
-
두 가지의 상쇄를 제공하여 상쇄의 매개 변수를 시장에 따라 조정할 수 있습니다.
-
CCI 지표에 따라 다시 오버 바이 오버 셀 영역에 들어가서 청산하여 트렌드 반전 수익을 잠금할 수 있다.
-
CCI 신호가 돋보이는 그림으로 쉽게 읽을 수 있다.
-
전략 논리는 명확하고 간단하며, 이해하기 쉽고 최적화됩니다.
위험 분석
-
CCI 지표가 지연되어 미스 리버스 또는 가짜 신호가 발생할 수 있습니다.
-
잘못된 EMA 변수 설정으로 트렌드를 놓치거나 전략을 무효화 할 수 있습니다.
-
상쇄율은 시장의 변화에 적응하기 어렵고, 넓은 변수를 설정한다.
-
ATR 중지 손해 차단기는 간격 주기에 민감하며 최적의 파라미터로 조정해야 합니다.
-
회수 위험성이 높기 때문에 위치 관리를 적절히 조정해야 합니다.
-
효과 시장 환경 변화에 따라 지표 매개 변수를 적절하게 평가합니다.
최적화 방향
-
다양한 주기의 CCI 변수를 평가하여 최적의 변수 조합을 찾습니다.
-
다양한 EMA 사이클을 테스트하여 가장 적합한 트렌드 판단 사이클을 결정합니다.
-
최적의 리스크/이익 비율을 얻기 위해 스톱/스트롭 파라미터를 조정합니다.
-
거래량과 같은 다른 필터 조건을 추가하여 가짜 신호를 더욱 필터링합니다.
-
트렌드 라인이나 그래프와 결합하여 형태적 판단을 통해 효과를 높이는 방법
-
포지션을 고정하는 것과 같은 포지션 관리 전략을 추가하여 철회 위험을 제어합니다.
-
다양한 시장 환경 데이터를 전체적으로 재검토하고, 동적으로 조정하는 매개 변수
요약하다
이 전략은 CCI 지표의 클래식 오버 바이 오버 셀드 원리를 적용하여 진입한다. EMA 필터를 추가하면 트렌드 방향을 제어할 수 있다. 두 가지의 스톱 스톱 방식을 제공하여 조정할 수 있다.
- 1