누적 RSI 파업 전략

저자:차오장, 날짜: 2023-10-27 11:20:50
태그:

img

전반적인 설명

이 전략은 kumulative RSI 지표를 사용하여 트렌드를 식별하고 kumulative RSI 값이 주요 임계 수준을 넘을 때 구매 및 판매 결정을 내립니다. 시장 소음을 효과적으로 필터하고 장기적인 트렌드 거래 기회를 캡처 할 수 있습니다.

전략 논리

이 전략은 주로 거래 결정에 대한 누적 RSI 지표에 기반합니다. 누적 RSI 지표는 RSI 값의 축적입니다. 누적 매개 변수를 설정함으로써, 지난 누적 일 동안의 RSI 값은 누적 RSI 지표를 도출하기 위해 더됩니다. 이 지표는 단기 시장 소음을 필터 할 수 있습니다.

누적 RSI 지표가 볼링거 밴드 상부 레일을 넘을 때, 긴 포지션이 열릴 것입니다. 누적 RSI가 볼링거 밴드 하부 레일을 넘을 때, 오픈 포지션은 닫힐 것입니다. 볼링거 밴드 레일은 여러 년 동안의 역사적 데이터에 기초하여 동적으로 계산됩니다.

또한 트렌드 필터 옵션이 추가되었습니다. 가격은 100 일 이동 평균 이상인 경우만 긴 거래를 열 수 있습니다. 즉 상승 트렌드 채널에 있습니다. 이 필터는 시장 변동 중에 잘못된 거래를 피합니다.

장점

  • 소음을 효과적으로 필터하고 누적 RSI를 사용하여 중장기 트렌드를 캡처합니다.
  • 트렌드 필터로 불합리한 거래를 피하십시오.
  • 결정에 고정된 값 대신 동적 기준 수준을 사용
  • 다른 시장에 기반한 조정에 대한 매우 구성 가능한 매개 변수
  • 10년 동안의 탁월한 백테스트 결과, 구매 및 보유보다 훨씬 더 나은 성과

위험 과 개선

  • 하나의 지표에만 기반을 둔 결정은 다른 지표나 필터를 추가할 수 있습니다.
  • 고정된 높은 레버리지 비율, 마감액에 따라 조정할 수 있습니다.
  • 단지 긴 거래, 짧은 기회를 볼 수 있습니다
  • 시장에 따라 크게 다른 매개 변수 조합을 최적화
  • 정지 손실, 이동 정지 손실 등으로 출구 조건을 부양합니다.
  • 시너지 효과를 위해 다른 전략과 결합하는 것을 고려하십시오.

요약

누적 RSI 브레이크아웃 전략은 원활한 논리 흐름을 가지고 있으며 누적 RSI와 필터링하여 중장기 트렌드를 정확하게 식별하고 트렌드 판단을 추가합니다. 지난 10 년 동안 백테스트 결과는 예외적입니다. 매개 변수 조정, 지표 추가, 전략을 더 견고하게 만들기 위해 출구 조건을 풍부하게하는 등의 분야에서 개선할 여지가 있습니다. 이 새로운 개념은 추가 탐색과 응용 가치가 있습니다.


/*backtest
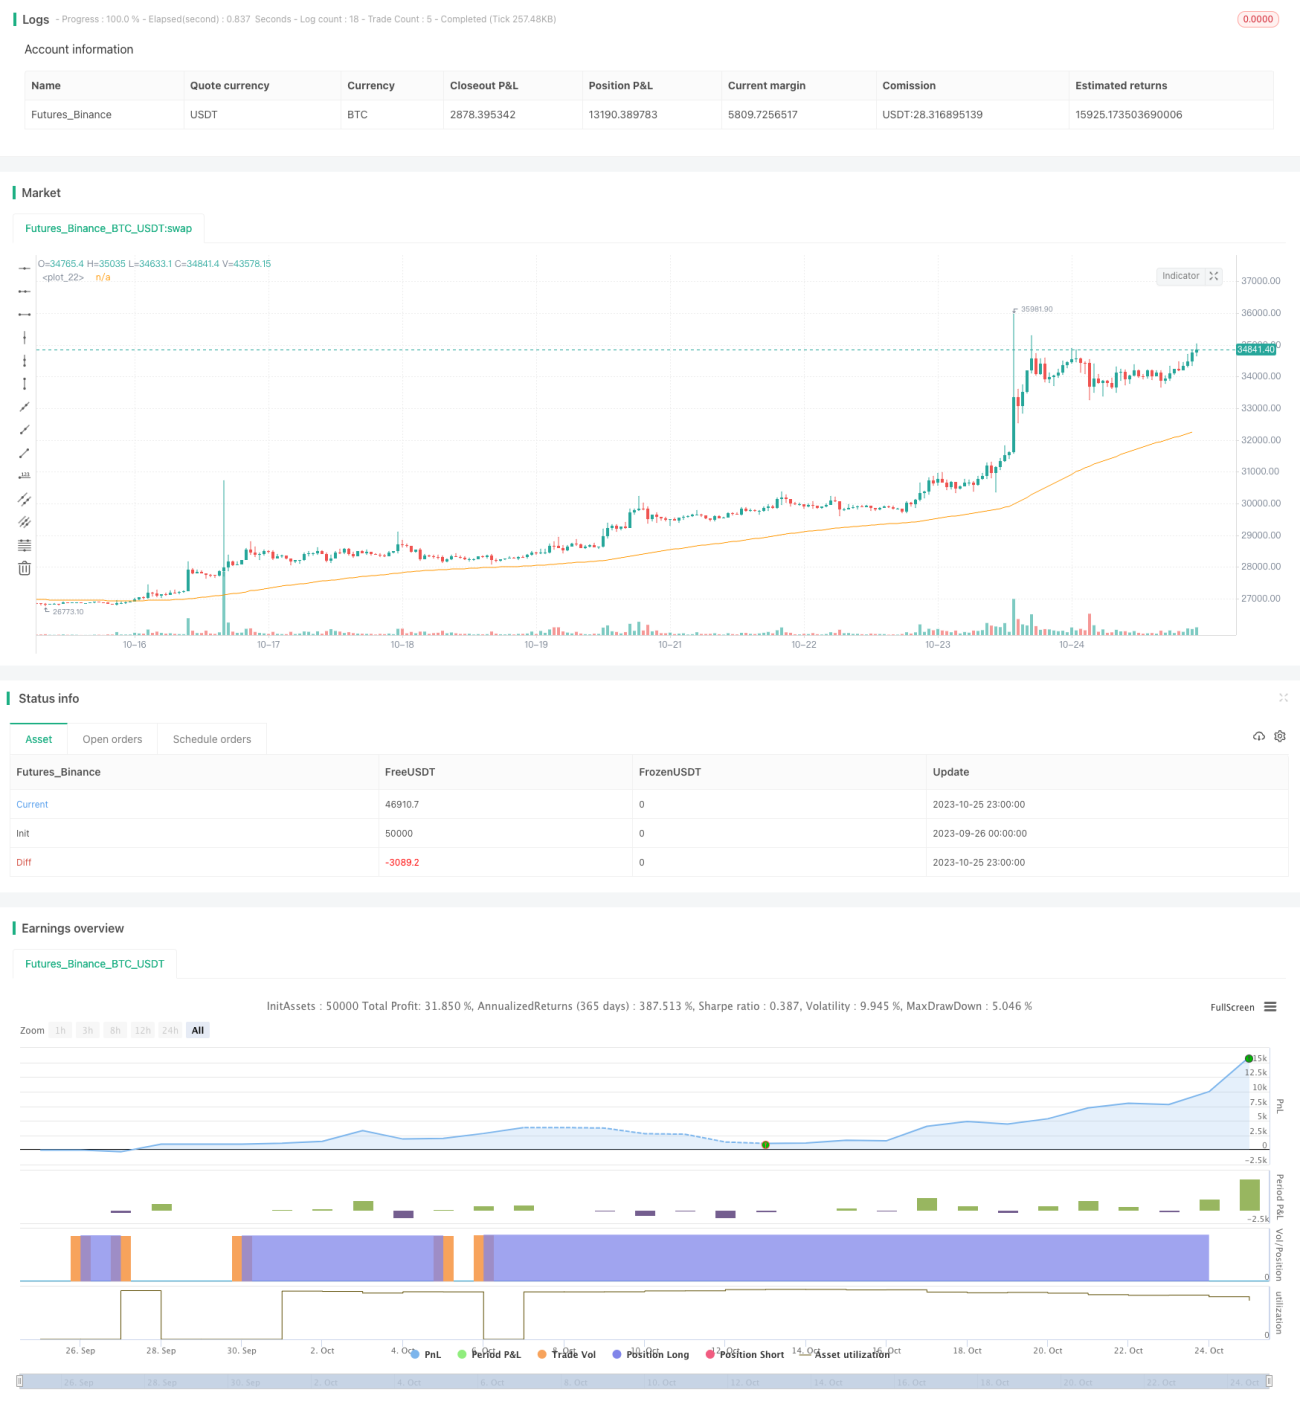
start: 2023-09-26 00:00:00
end: 2023-10-26 00:00:00
period: 1h
basePeriod: 15m
exchanges: [{"eid":"Futures_Binance","currency":"BTC_USDT"}]
*/

// This source code is subject to the terms of the Mozilla Public License 2.0 at https://mozilla.org/MPL/2.0/
// @version=5
// Author = TradeAutomation


strategy(title="Cumulative RSI Strategy", shorttitle="CRSI Strategy", process_orders_on_close=true, overlay=true, commission_type=strategy.commission.cash_per_contract, commission_value=.0035, slippage = 1, margin_long = 75, initial_capital = 25000, default_qty_type=strategy.percent_of_equity, default_qty_value=110)


// Cumulative RSI Indicator Calculations //
rlen  = input.int(title="RSI Length", defval=3, minval=1)
cumlen = input(3, "RSI Cumulation Length")
rsi = ta.rsi(close, rlen)
cumRSI = math.sum(rsi, cumlen)
ob = (100*cumlen*input(94, "Oversold Level")*.01)
os = (100*cumlen*input(20, "Overbought Level")*.01)


// Operational Function //
TrendFilterInput = input(false, "Only Trade When Price is Above EMA?")
ema = ta.ema(close, input(100, "EMA Length"))
TrendisLong = (close>ema)
plot(ema)


// Backtest Timeframe Inputs // 
startDate = input.int(title="Start Date", defval=1, minval=1, maxval=31)
startMonth = input.int(title="Start Month", defval=1, minval=1, maxval=12)
startYear = input.int(title="Start Year", defval=2010, minval=1950, maxval=2100)
endDate = input.int(title="End Date", defval=1, minval=1, maxval=31)
endMonth = input.int(title="End Month", defval=1, minval=1, maxval=12)
endYear = input.int(title="End Year", defval=2099, minval=1950, maxval=2100)
InDateRange = (time >= timestamp(syminfo.timezone, startYear, startMonth, startDate, 0, 0)) and (time < timestamp(syminfo.timezone, endYear, endMonth, endDate, 0, 0))


// Buy and Sell Functions //
if (InDateRange and TrendFilterInput==true)
    strategy.entry("Long", strategy.long, when = ta.crossover(cumRSI, os) and TrendisLong, comment="Buy", alert_message="buy")
    strategy.close("Long", when = ta.crossover(cumRSI, ob) , comment="Sell", alert_message="Sell")
if (InDateRange and TrendFilterInput==false)
    strategy.entry("Long", strategy.long, when = ta.crossover(cumRSI, os), comment="Buy", alert_message="buy")
    strategy.close("Long", when = ta.crossover(cumRSI, ob), comment="Sell", alert_message="sell")
if (not InDateRange)
    strategy.close_all()

더 많은