
이 전략의 주요 아이디어는 EMA 지표의 골드 포크와 데드 포크 신호를 사용하여 구매 및 판매 작업을 수행하는 것입니다. 그것은 동시에 여러 개의 빠른 느린 EMA를 그리며 교차를 사용하여 거래 신호의 판단을 수행합니다.
이 전략은 먼저 여러 개의 EMA 평균선을 정의하며, 빠른 EMA 평균선 eMA1에서 eMA6 그리고 느린 EMA 평균선 eMA7에서 eMA12을 포함한다. 그 다음에는 구매 신호 (buy_signal) 와 판매 신호 (sell_signal) 를 정의한다:
이렇게, 단기 EMA 평균선 위에 장기 EMA 평균선을 뚫을 때, 시장이 상승 추세에 있다는 것을 나타내며, 구매한다. 단기 EMA 평균선 아래에 장기 EMA 평균선 위에 뚫을 때, 시장이 하향 추세에 있다는 것을 나타내며, 판매한다.
이 전략은 EMA 평균선의 교차를 모니터링하여 트렌드 방향을 판단하여 구매 및 판매 결정을 내립니다.
이 전략에는 다음과 같은 장점이 있습니다.
EMA 평균선 지표를 사용하여 트렌드를 판단하고, EMA 평균선은 가격변동에 대해 더 부드럽고, 단기시장 소음을 필터링하여 거래 신호를 더 신뢰할 수 있다.
동시에 여러 개의 EMA 평균선을 그리는 것은 트렌드의 변화를 더 정확하게 판단할 수 있다. 빠른 느린 EMA 선의 교차는 중요한 트렌드 전환점을 놓치지 않도록 한다.
전략은 간단하고 명확하며, EMA 교차로 거래 신호를 발산하고, 이해하기 쉬운 구현, 양적 거래에 적합하다.
사용자 정의 가능한 EMA 주기 파라미터, 다양한 품종과 시장에 따라 파라미터를 조정할 수 있으며, 시장 변화에 유연하게 대응한다.
이 전략에는 다음과 같은 위험도 있습니다.
EMA 평균선은 지연성이 있어 거래 신호를 지연시킬 수 있다.
잘못된 EMA 파라미트 조합을 선택하면 잘못된 거래 신호가 발생할 수 있습니다.
EMA 교차는 진동 영역에서 발생하는 가짜 신호를 효과적으로 필터링 할 수 없습니다.
과도한 적합성의 위험이 존재하며, EMA 파라미터를 최적화할 수 있는 공간이 제한되어 있다.
대책:
다른 지표와 함께 필터링을 통해 진동 영역에서 잘못된 신호를 피하십시오.
다른 주기 파라미터의 안정성을 테스트하여 과도한 적합성을 방지한다.
적절하게 전략적 변수 모음을 조정하거나 출구 메커니즘을 추가하여 위험을 제어하십시오.
이 전략은 다음과 같은 부분에서 최적화될 수 있습니다.
손실을 막는 전략을 추가하고, 손실이 일정 정도에 도달하면 손실을 막고 탈퇴한다.
다시 시장에 진입하는 메커니즘을 추가하는 것은 다시 매입하는 신호를 설정하는 것입니다.
구매와 판매의 EMA 교차주기 파라미터 조합을 최적화하여 최적의 파라미터를 찾는다.
다른 지표 판단, 다중 인자 검증, 신호 품질 향상.
다양한 품종의 파라미터를 최적화하여 최적의 적용 범위를 찾기 위해 테스트한다.
실 디스크 거래의 슬라이드 요소를 고려하여 재측정 조정한다.
이 전략은 EMA 평균선의 빠른 느린 교차 판단 트렌드 방향, 교차 신호에 따라 구매 및 판매를 하는, 더 간단한 트렌드 추적 전략이다. 그것은 트렌드 변화 판단의 장점이 있지만, 또한 지연성 및 흔들림 영역의 위험이 있다. 중지 손실, 매개 변수 최적화, 다중 인자 검증과 같은 방법을 통해 전략 효과를 더 강화하고, 재측정 및 실판에서 계속 개선할 수 있다.
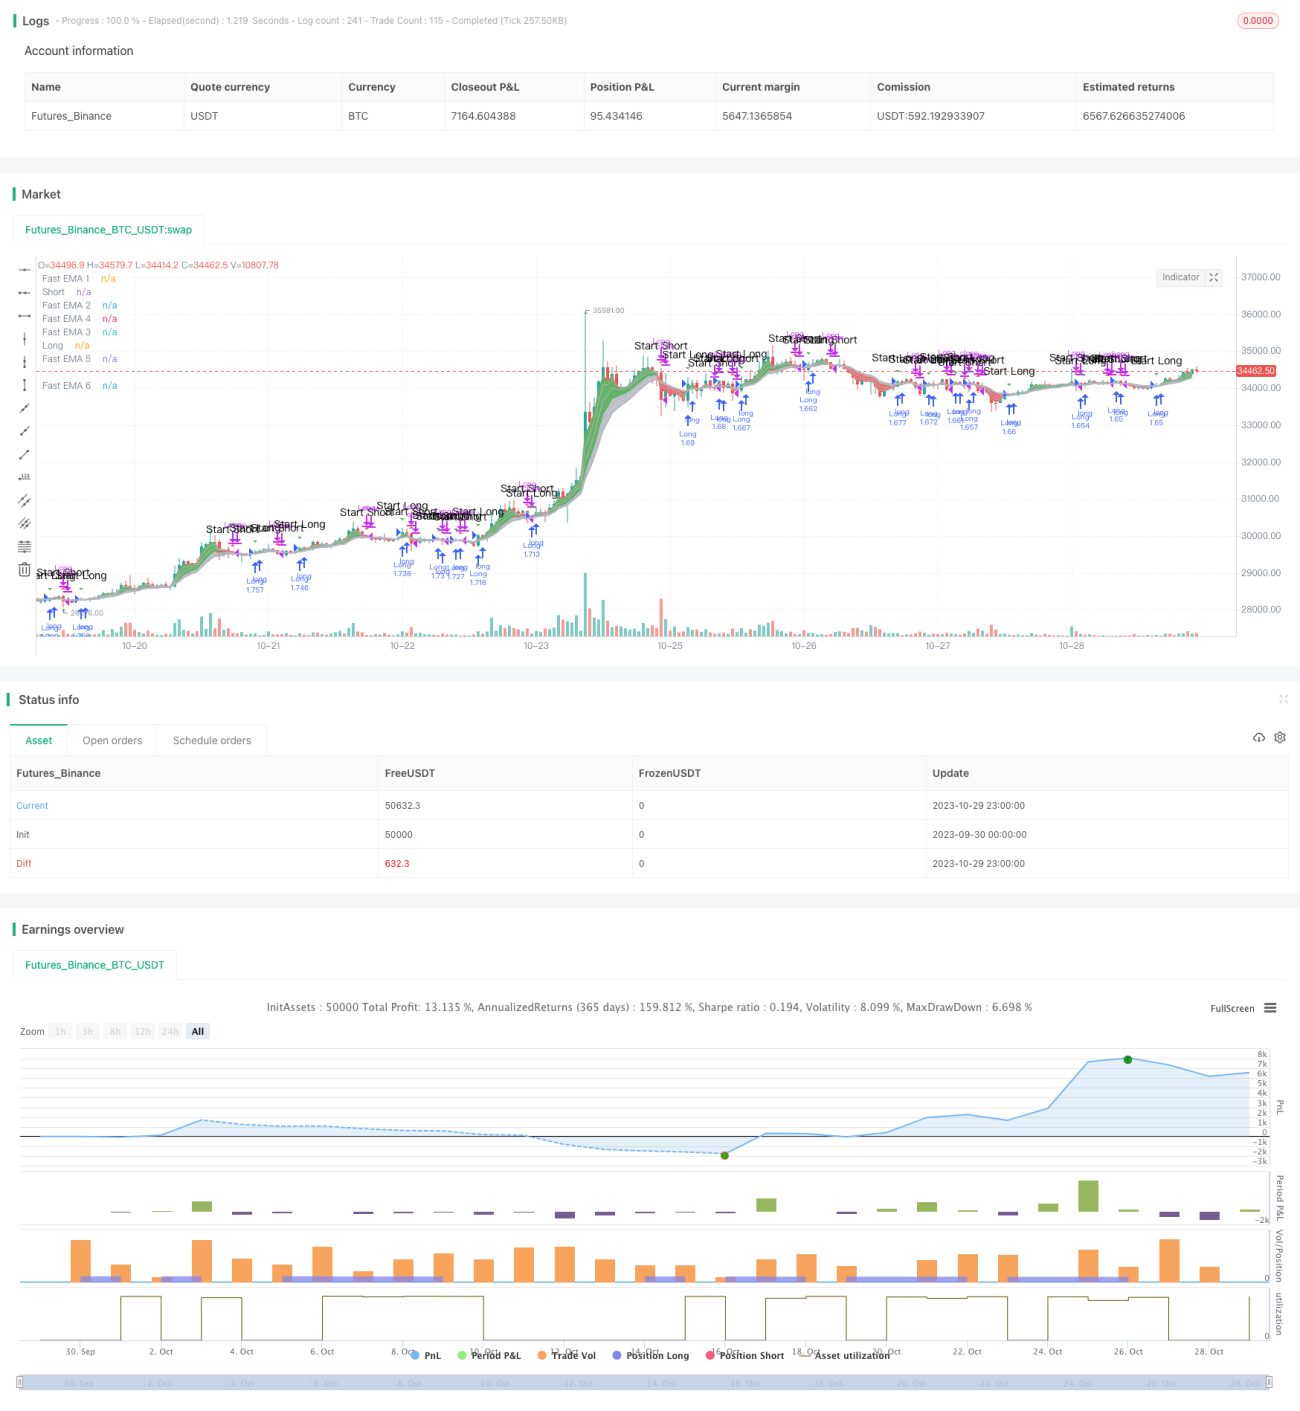
/*backtest
start: 2023-09-30 00:00:00
end: 2023-10-30 00:00:00
period: 1h
basePeriod: 15m
exchanges: [{"eid":"Futures_Binance","currency":"BTC_USDT"}]
*/
//@version=3
//Companion Strategy script to my Cloud Study. Enjoy! -MP
// study("MP's Cloud Study", overlay=true)
strategy(title="MP's Cloud Strat'", shorttitle="MP's Cloud Strat", overlay=true, precision=6, pyramiding=0, initial_capital=10000, currency="USD", default_qty_type=strategy.percent_of_equity,calc_on_order_fills= false, calc_on_every_tick=false, default_qty_value=100.0, commission_type=strategy.commission.percent, commission_value=0.05)
//bgcolor ( color=black, transp=20, title='Blackground', editable=true)
src = close, len1 = input(2, minval=1, title="Short EMA")
src2 = close, len3 = input(7, minval=1, title="Long EMA")
emaShort = ema(src, len1)
emaLong = ema(src2, len3)
StartYear = input(2018, "Start Year")
StartMonth = input(01, "Start Month")
StartDay = input(18, "Start Day")
StopYear = input(2018, "Stop Year")
StopMonth = input(12, "Stop Month")
StopDay = input(26, "Stop Day")
tradeStop = timestamp(StopYear,StopMonth,StopDay,0,0)
//src = close,
//len1 = input(3, minval=1, title="Fast EMA 1")
len2 = input(3, minval=1, title="Fast EMA 2")
//len3 = input(8, minval=1, title="Fast EMA 3")
len4 = input(5, minval=1, title="Fast EMA 4")
len5 = input(8, minval=1, title="Fast EMA 5")
len6 = input(10, minval=1, title="Fast EMA 6")
//Slow EMA
len7 = input(30, minval=1, title="Slow EMA 7")
len8 = input(35, minval=1, title="Slow EMA 8")
len9 = input(40, minval=1, title="Slow EMA 9")
len10 = input(45, minval=1, title="Slow EMA 10")
len11 = input(50, minval=1, title="Slow EMA 11")
len12 = input(60, minval=1, title="Slow EMA 12")
//Fast EMA
ema1 = ema(src, len1)
ema2 = ema(src, len2)
ema3 = ema(src, len3)
ema4 = ema(src, len4)
ema5 = ema(src, len5)
ema6 = ema(src, len6)
//Slow EMA
ema7 = ema(src, len7)
ema8 = ema(src, len8)
ema9 = ema(src, len9)
ema10 = ema(src, len10)
ema11 = ema(src, len11)
ema12 = ema(src, len12)
//Fast EMA Color Rules
//colfastL = (ema1 > ema2 and ema2 > ema3 and ema3 > ema4 and ema4 > ema5 and ema5 > ema6)
colfastS = (ema1 < ema2 and ema2 < ema3 and ema3 < ema4 and ema4 < ema5 and ema5 < ema6)
//Slow EMA Color Rules
//colslowL = ema7 > ema8 and ema8 > ema9 and ema9 > ema10 and ema10 > ema11 and ema11 > ema12
//colslowS = ema7 < ema8 and ema8 < ema9 and ema9 < ema10 and ema10 < ema11 and ema11 < ema12
//Fast EMA Final Color Rules
//colFinal = colfastL and colslowL? aqua : colfastS and colslowS? orange : gray
//Slow EMA Final Color Rules
//colFinal2 = colslowL ? lime : colslowS ? red : gray
//Fast EMA Plots
p1=plot(ema1, title="Fast EMA 1", style=line, linewidth=2, color=silver)
plot(ema2, title="Fast EMA 2", style=line, linewidth=1, color=silver)
plot(ema3, title="Fast EMA 3", style=line, linewidth=1, color=silver)
plot(ema4, title="Fast EMA 4", style=line, linewidth=1, color=silver)
plot(ema5, title="Fast EMA 5", style=line, linewidth=1, color=silver)
p2=plot(ema6, title="Fast EMA 6", style=line, linewidth=2, color=silver)
fill(p1,p2,color=silver, transp=60)
//Slow EMA Plots
//p3=plot(ema7, title="Slow EMA 7", style=line, linewidth=4, color=colFinal2)
//plot(ema8, title="Slow EMA 8", style=line, linewidth=3, color=colFinal2)
//plot(ema9, title="Slow EMA 9", style=line, linewidth=3, color=colFinal2)
//plot(ema10, title="Slow EMA 10", style=line, linewidth=3, color=colFinal2)
//plot(ema11, title="Slow EMA 11", style=line, linewidth=3, color=colFinal2)
//p4=plot(ema12, title="Slow EMA 12", style=line, linewidth=4, color=colFinal2)
//fill(p3,p4, color=silver, transp=60)
//Plot the Ribbon
ma1=plot( emaShort,color=rising(emaShort,2)?green:red,linewidth=1,join=true,transp=20,title="Short")
ma2=plot( emaLong,color=rising(emaLong,2)?green:red,linewidth=1,join=true,transp=20,title="Long")
fcolor = emaShort>emaLong?green:red
fill(ma1,ma2,color=fcolor,transp=80,title="Ribbon Fill")
//fast = 4, slow = 16
//fastMA = ema(close, fast)
//slowMA = ema(close, slow)
//plot(fastMA, color=green, title = "buy/sell")
//plot(slowMA, color=red, title = "base")
//Conditions
buy_signal = crossover(ema1,ema3)
sell_signal = crossunder(ema1,ema3)
plotshape(sell_signal, style=shape.triangleup, color = red, text="Start Short")
plotshape(buy_signal, style=shape.triangledown, color = green, text="Start Long")
alertcondition(sell_signal, title = 'Sell/Short', message = 'e= s= c=position b=long t=market l= | delay=30 | e= s= b=short l= t=market q=0.01')
alertcondition(buy_signal, title = 'Buy/Long', message = 'e= s= c=position b=short t=market l= | delay=30 | e= s= b=long l= t=market q=0.01')
//alertcondition(sell_signal, title = 'Sell/Short', message = 'e= s= c=order b=buy | delay=3 | e= b=sell q=99% p=0.70% u=currency')
//alertcondition(buy_signal, title = 'Buy/Long', message = 'e= s= c=order b=sell | delay=30 | e= b=buy q=80 p=0.1% u=currency')
testStartYear = input(2018, "From Year")
testStartMonth = input(1, "From Month")
testStartDay = input(1, "From Day")
testPeriodStart = timestamp(testStartYear,testStartMonth,testStartDay,0,0)
testStopYear = input(2019, "To Year")
testStopMonth = input(1, "To Month")
testStopDay = input(1, "To Day")
testPeriodStop = timestamp(testStopYear,testStopMonth,testStopDay,0,0)
testPeriod() => true
if testPeriod()
if buy_signal
strategy.entry("Long", true)
if sell_signal
strategy.close("Long")