하이로우 지표와 이동평균 지표 전략

개요
이 전략은 주로 고저 지표, 평균선 지표와 슈퍼 트렌드 지표를 결합하여 시장 추세를 판단하여 입장을 세운다.
전략 원칙
-
높은 낮은 지표를 통해 최근 특정 주기 동안 가격이 새로운 높이를 만들거나 새로운 낮은 것을 판단하고 점수를 쌓습니다. 점수가 증가하면 다면 힘이 증가하고 점수가 감소하면 공백 힘이 증가합니다.
-
평균선 지표를 통해, 가격이 위아래로 올라가는 계단형 상승 트렌드에 있는지, 또는 위아래로 내려가는 계단형 하락 트렌드에 있는지 판단한다. 평균선이 계단형 상승을 나타낸다면, 다중 힘의 증가를 나타냅니다. 평균선이 계단형 하락을 나타낸다면, 공중 힘의 증가를 나타냅니다.
-
고저 지표와 평균선 지표의 판단 결과를 결합하여 시장 추세를 결정합니다. 슈퍼 트렌드 지표의 방향과 결합하여 포지션 구축 기회를 찾습니다. 구체적으로, 고저 지표와 평균선 지표가 다목적 세력이 증가하고 슈퍼 트렌드 지표가 하향을 향하면 긴 포지션을 구축합니다. 고저 지표와 평균선 지표가 공백 세력이 증가하고 슈퍼 트렌드 지표가 위쪽으로 향하면 빈 포지션을 구축합니다.
전략적 이점
-
고저 지표는 가격의 움직임과 힘의 변화를 효과적으로 판단할 수 있고, 평선 지표는 가격의 흐름을 효과적으로 판단할 수 있으며, 둘을 결합하면 시장의 방향을 더 정확하게 판단할 수 있다.
-
슈퍼 트렌드 지표와 결합하여 포지션을 구축하면 조기 또는 너무 늦게 포지션을 구축하는 것을 피할 수 있습니다. 슈퍼 트렌드 지표는 가격 반전 지점을 효과적으로 식별 할 수 있습니다.
-
여러 지표가 서로 검증되어 잘못된 신호를 줄일 수 있습니다.
전략적 위험
-
만약 고저 지표와 평균선 지표가 잘못된 신호를 내면, 손실을 초래할 수 있다.
-
참여율이 높지 않은 경우, 슈퍼 트렌드 지표의 매개 변수가 잘못 설정되면 잘못된 신호가 나올 수 있다.
-
트렌드가 너무 빨리 역전되면, 잘못된 스톱 로즈 설정으로 인해 큰 손실이 발생할 수 있습니다.
-
지표 파라미터를 최적화하고, 스톱포인트 지점을 조정하는 등의 방법으로 위험을 줄일 수 있다.
전략 최적화
-
다양한 종류의 평균선 지표를 테스트하여 최적의 변수 조합을 찾을 수 있다.
-
높낮이 지표와 평균선 지표의 파라미터를 최적화하여 신호를 더 안정적이고 신뢰할 수 있도록 한다.
-
MACD, KD 등과 같은 다른 지표와 함께 검증할 수 있으며, 가짜 신호를 줄일 수 있다.
-
기계 학습 알고리즘을 결합하여 자동으로 최적화 가능한 파라미터와 신호 무게.
-
감정 분석과 같은 시장 열기를 판단하여 낮은 열기의 품종을 거래하는 것을 피하십시오.
요약하다
이 전략은 높은 낮은 지표와 평균선 지표를 통해 시장 추세와 힘을 판단하고, 슈퍼 트렌드 지표 필터 신호를 결합하여, 다공력 대결과 슈퍼 트렌드 지표 반전시 포지션을 구축하여, 저 위험 거래를 실현한다. 전략의 장점은 다중 지표 검증과 적시에 포지션을 구축하여 위험을 효과적으로 제어할 수 있다. 문제가있는 것은 가짜 신호와 트렌드 판단 오류이다. 파라미터 최적화, 스톱 손실 설정, 신호 필터 등 여러 가지 방법으로 개선할 수 있으며, 전략은 더 안정적이고 신뢰할 수 있다.
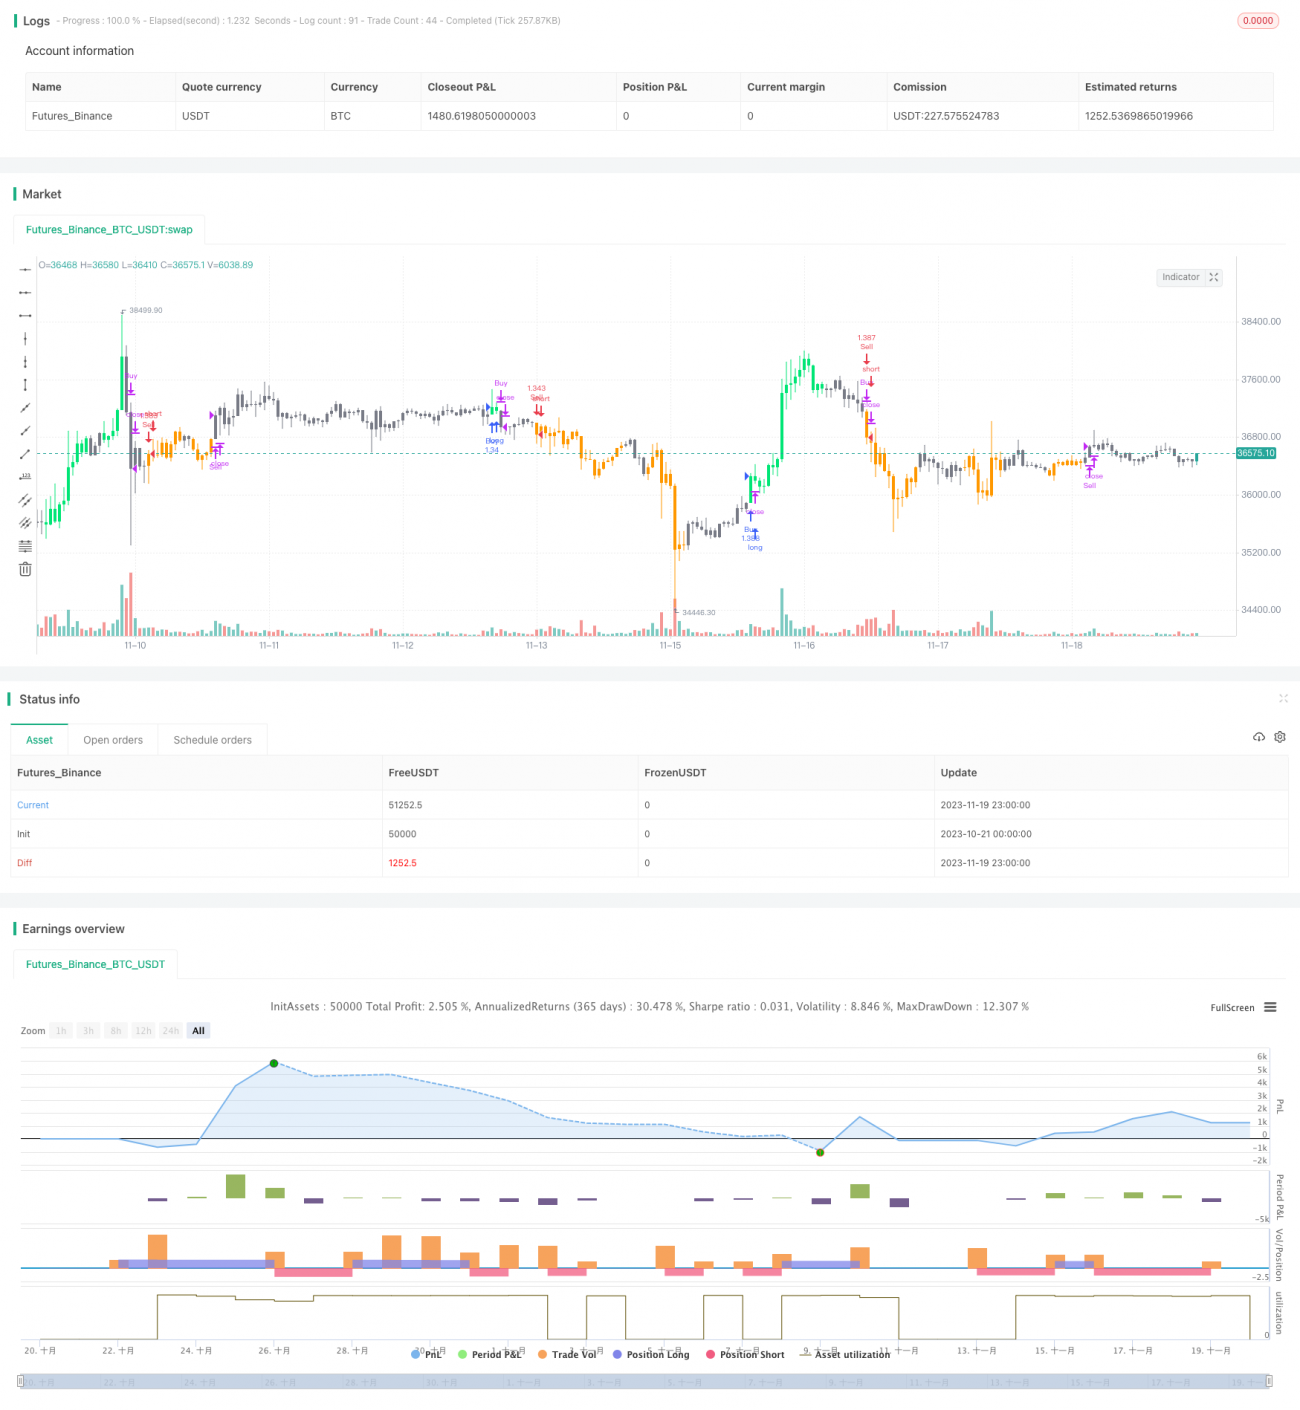
/*backtest
start: 2023-10-21 00:00:00
end: 2023-11-20 00:00:00
period: 1h
basePeriod: 15m
exchanges: [{"eid":"Futures_Binance","currency":"BTC_USDT"}]
*/

// This source code is subject to the terms of the Mozilla Public License 2.0 at https://mozilla.org/MPL/2.0/
// © HeWhoMustNotBeNamed

//@version=4- 1