
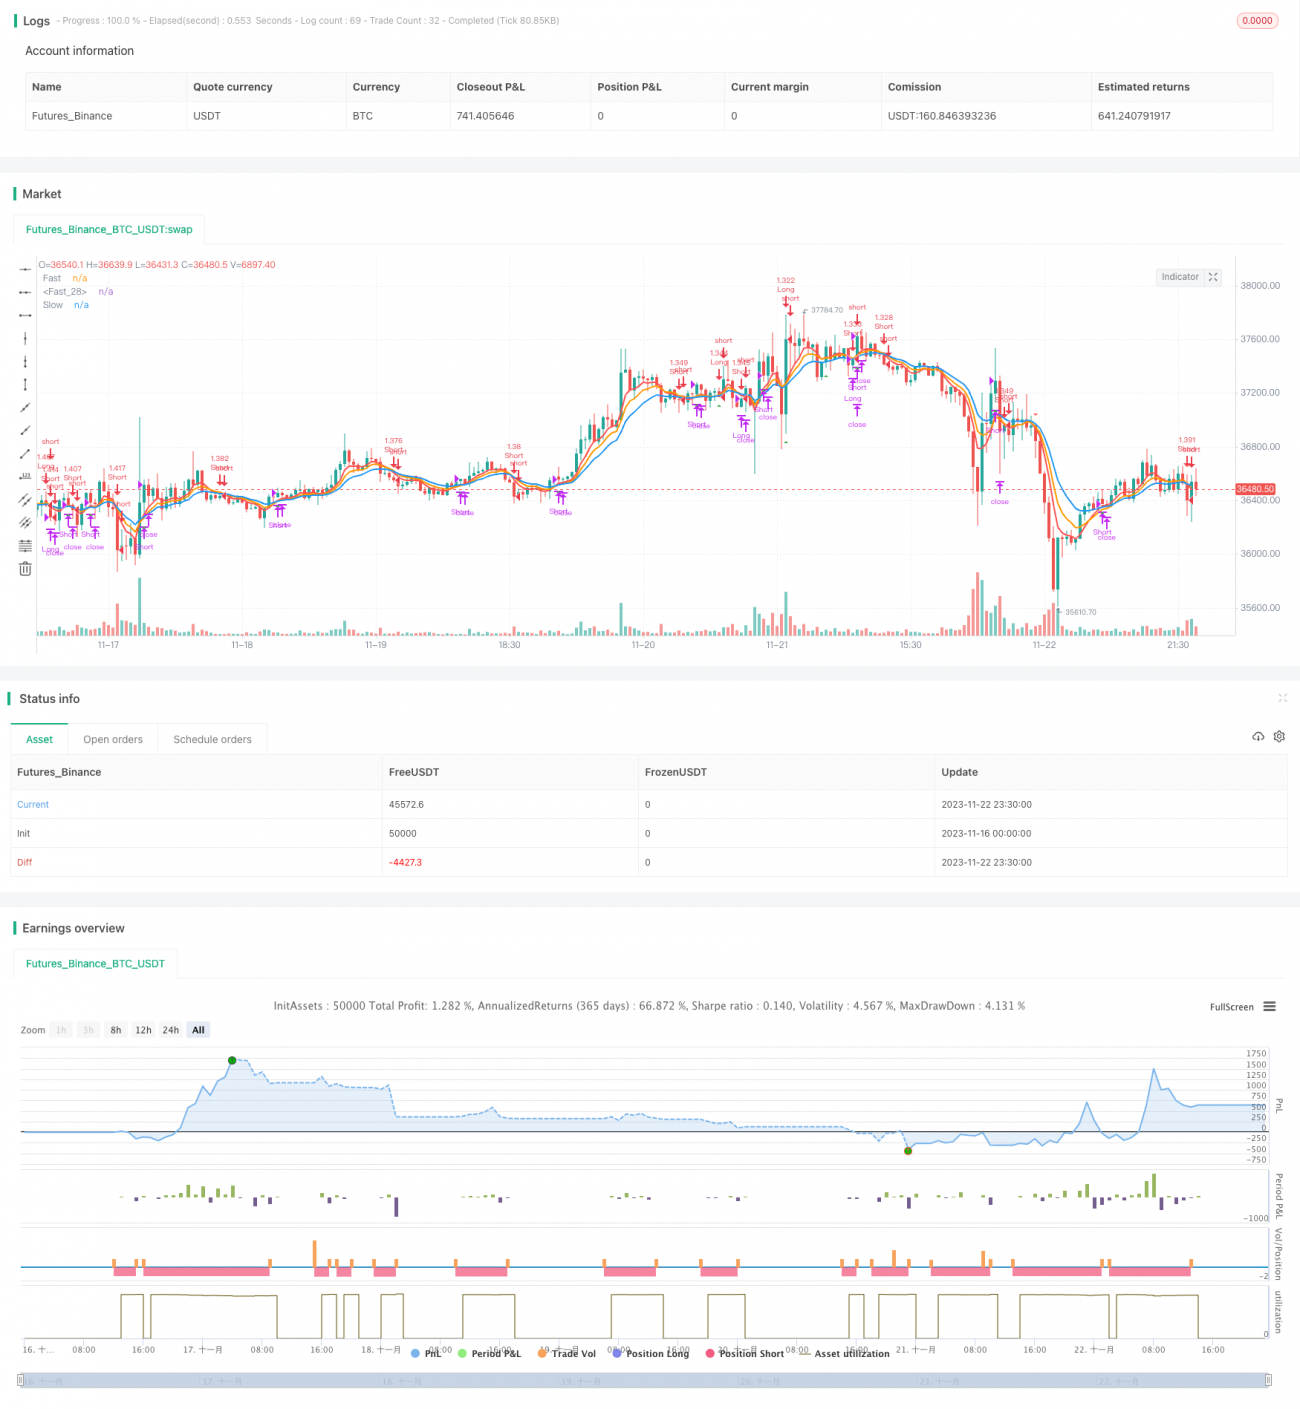
이 전략은 단기, 중기, 장기 3개의 다른 주기들의 지수 이동 평균 (EMA) 을 기반으로 거래 신호를 생성한다. 그 중, 단기 EMA 주기는 5일이고, 중기 EMA 주기는 8일이고, 장기 EMA 주기는 13일이다. 단기 EMA가 중기 및 장기 EMA를 통과하면 더 많이 하고, 단기 EMA가 중기 및 장기 EMA를 통과하면 더 적게 한다.
이 전략은 서로 다른 주기의 EMA를 계산하여 시장의 흐름을 판단한다. 단기 EMA는 최근 며칠의 평균 가격을 반영하고, 중기 EMA는 더 긴 기간의 평균 가격을 반영한다. 단기 EMA 위를 가로질러 중기 장기 EMA는 가격이 상향으로 돌파되기 시작하여 더 많이 한다. 단기 EMA 아래를 가로질러 중기 장기 EMA는 가격이 하향으로 돌파되기 시작하여 공백한다.
구체적으로, 이 전략은 동시에 5일, 8일, 13일 세 개의 EMA를 계산한다. 5일 EMA 위 8일과 13일 EMA를 착용할 때 다수 신호가 생성된다. 5일 EMA 아래 8일과 13일 EMA를 착용할 때 다수 신호가 생성된다. 다수 후, 5일 EMA가 다시 13일 EMA를 착용할 경우, 평지된다.
다음의 방법으로 최적화할 수 있습니다.
이 전략은 짧은 중장기 3주기 EMA를 계산하고 그 교차 상황을 비교하여 시장 추세 전환을 판단하는 전형적인 돌파 시스템이다. 이 전략의 장점은 거래 신호가 간단하고 명확하며 조작하기 쉽다는 것이다. 단점은 EMA 지표 자체가 지연되어 실제 추세와 단기 조정의 차이를 구별할 수 없다는 것이다.
/*backtest
start: 2023-11-16 00:00:00
end: 2023-11-23 00:00:00
period: 30m
basePeriod: 15m
exchanges: [{"eid":"Futures_Binance","currency":"BTC_USDT"}]
*/
//@version=4
//
// This source code is subject to the terms of the Mozilla Public License 2.0 at https://mozilla.org/MPL/2.0/
// © gregoirejohnb
// @It is modified by ttsaadet.
// Moving average crossover systems measure drift in the market. They are great strategies for time-limited people.
// So, why don't more people use them?
//
//
strategy(title="EMA Crossover Strategy", shorttitle="EMA-5-8-13 COS by TTS", overlay=true, pyramiding=0, default_qty_type=strategy.percent_of_equity, default_qty_value=100, currency=currency.TRY,commission_type=strategy.commission.percent,commission_value=0.04, process_orders_on_close = true, initial_capital = 100000)
// === GENERAL INPUTS ===
//strategy start date
start_year = input(defval=2020, title="Backtest Start Year")
// === LOGIC ===
short_period = input(type=input.integer,defval=5,minval=1,title="Length")
mid_period = input(type=input.integer,defval=8,minval=1,title="Length")
long_period = input(type=input.integer,defval=13,minval=1,title="Length")
longOnly = input(type=input.bool,defval=false,title="Long Only")
shortEma = ema(hl2,short_period)
midEma = ema(hl2,mid_period)
longEma = ema(hl2,long_period)
plot(shortEma,linewidth=2,color=color.red,title="Fast")
plot(midEma,linewidth=2,color=color.orange,title="Fast")
plot(longEma,linewidth=2,color=color.blue,title="Slow")
longEntry = ((shortEma > midEma) and crossover(shortEma,longEma)) or ((shortEma > longEma) and crossover(shortEma,midEma))
shortEntry =((shortEma < midEma) and crossunder(shortEma,longEma)) or ((shortEma < longEma) and crossunder(shortEma,midEma))
plotshape(longEntry ? close : na,style=shape.triangleup,color=color.green,location=location.belowbar,size=size.small,title="Long Triangle")
plotshape(shortEntry and not longOnly ? close : na,style=shape.triangledown,color=color.red,location=location.abovebar,size=size.small,title="Short Triangle")
plotshape(shortEntry and longOnly ? close : na,style=shape.xcross,color=color.black,location=location.abovebar,size=size.small,title="Exit Sign")
// === STRATEGY - LONG POSITION EXECUTION ===
enterLong() =>
longEntry
exitLong() =>
crossunder(shortEma,longEma)
strategy.entry(id="Long", long=strategy.long, when=enterLong())
strategy.close(id="Long", when=exitLong())
// === STRATEGY - SHORT POSITION EXECUTION ===
enterShort() =>
not longOnly and shortEntry
exitShort() =>
crossover(shortEma,longEma)
strategy.entry(id="Short", long=strategy.short, when=enterShort())
strategy.close(id="Short", when=exitShort())