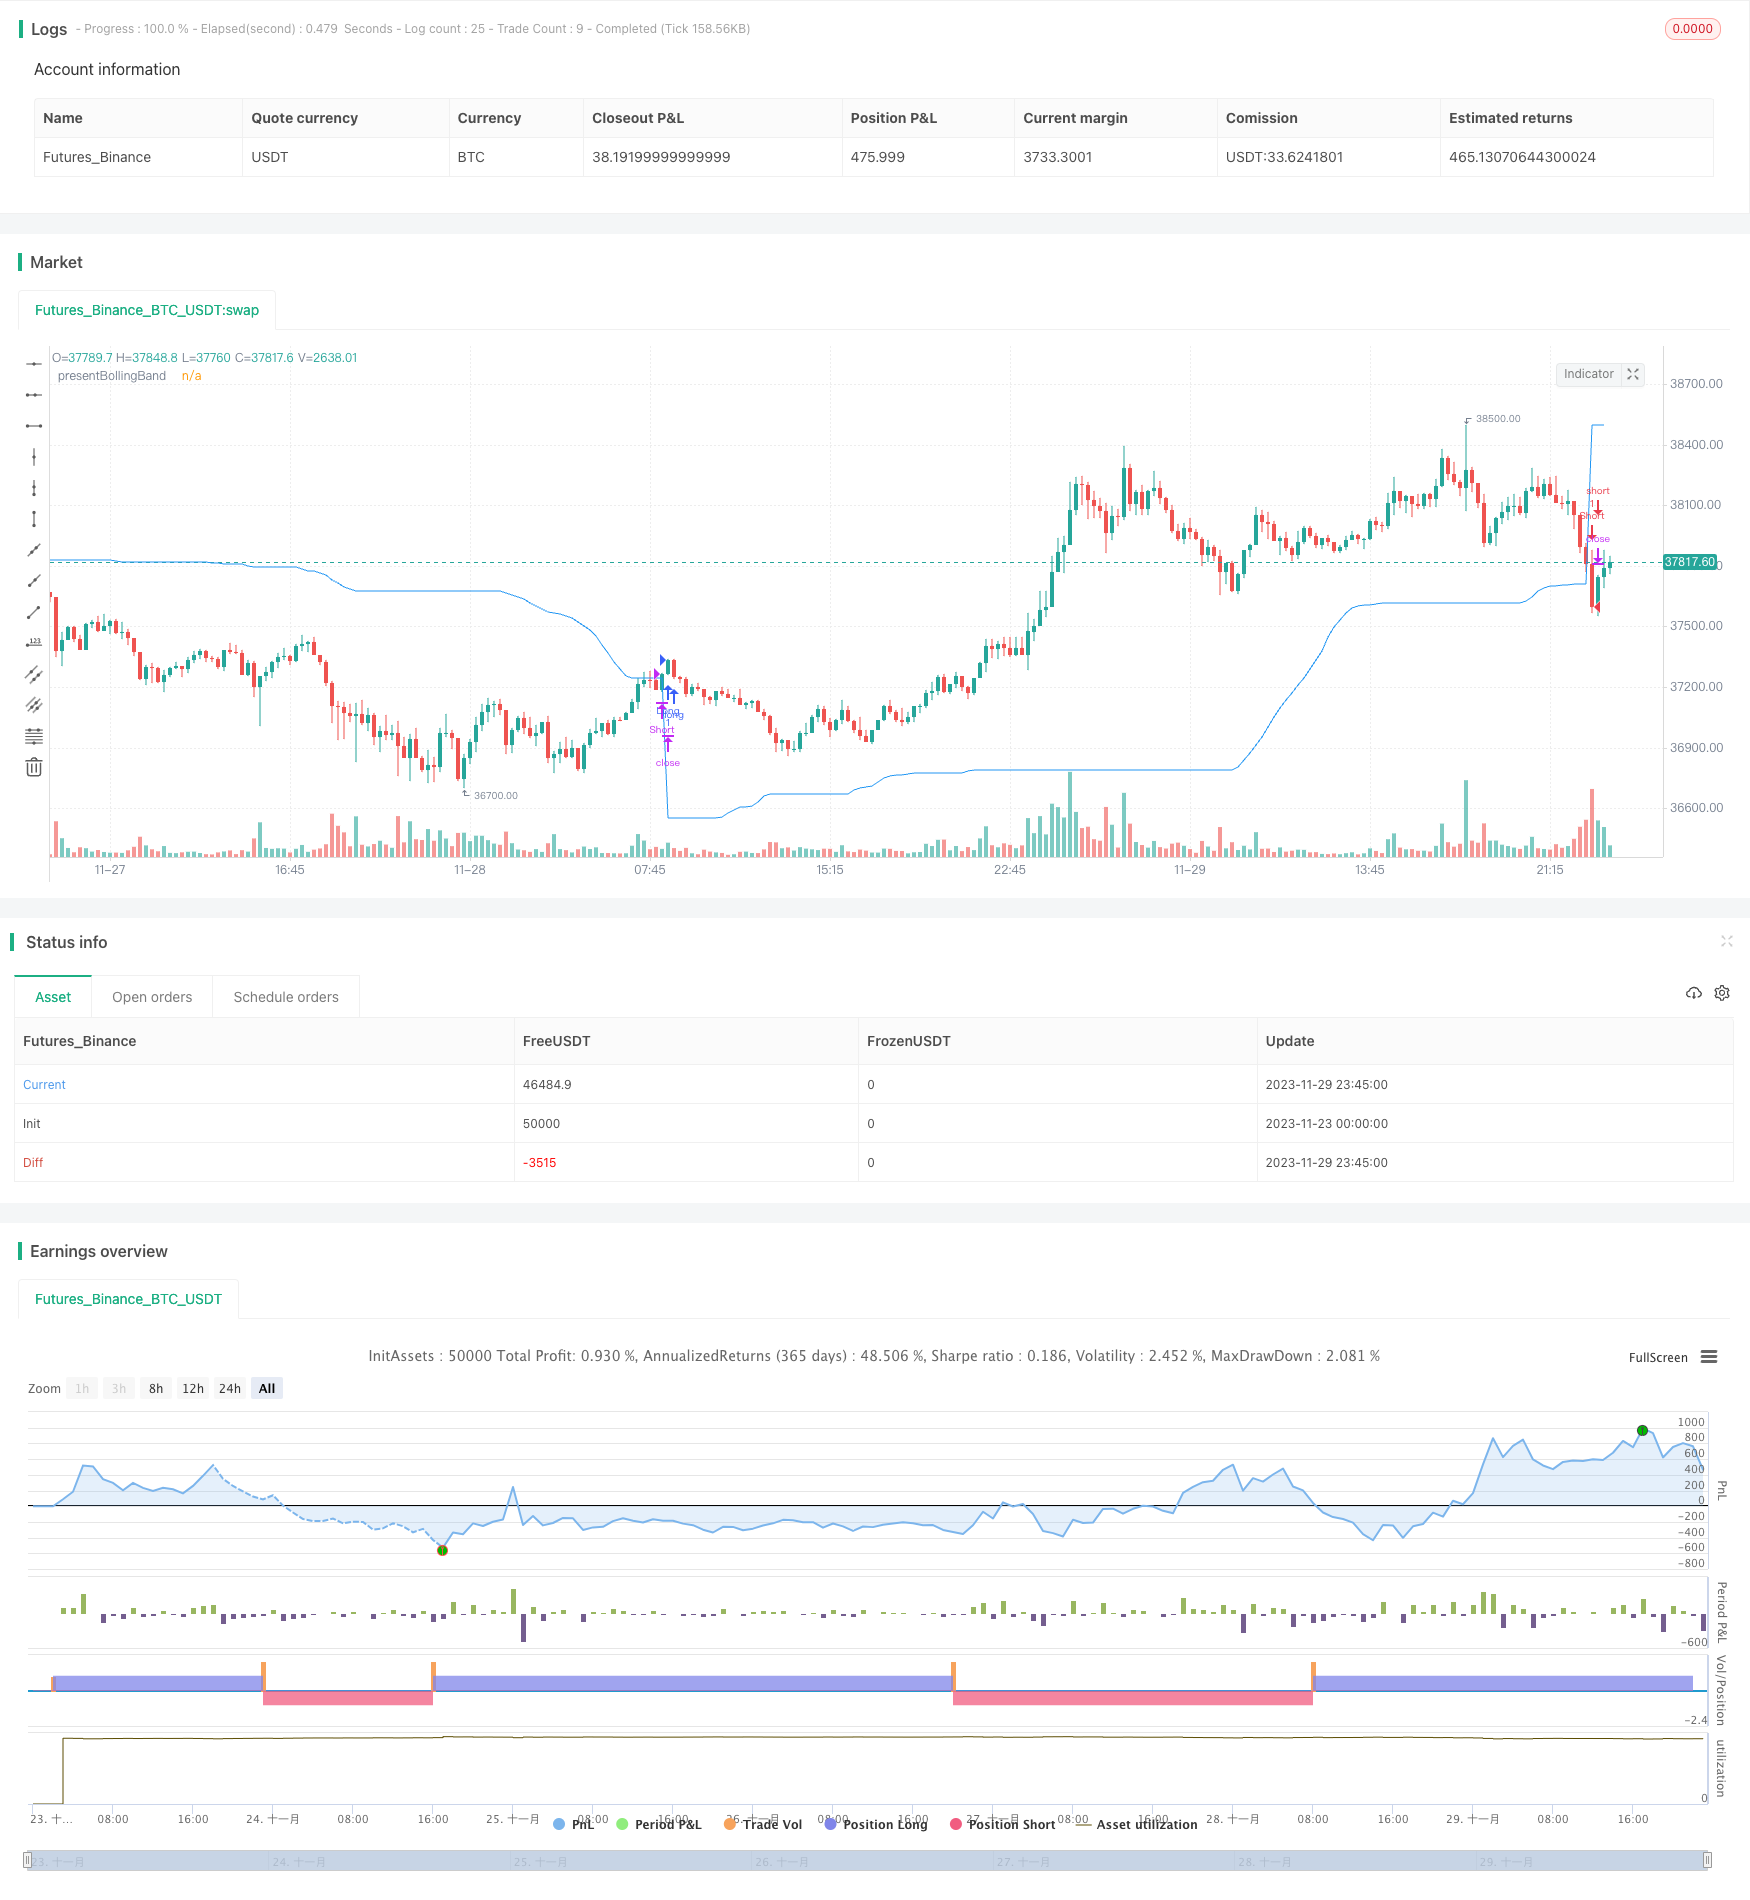
개요
동적 파장을 포착 RSI-블린 밴드 전략은 브린 밴드 ((BB), 상대적으로 강한 지표 ((RSI) 및 간단한 이동 평균 ((SMA) 이 통합된 거래 전략이다. 이 전략의 독특한 점은 상위 궤도와 하위 궤도 사이의 종료 가격에 따라 동적 수준을 계산한다는 것이다. 이 독특한 기능은 이 전략이 시장의 변동성과 가격 변화에 적응할 수 있도록 해준다.
암호화폐와 주식 시장은 매우 변동적이기 때문에 브린 밴드 전략을 적용하는 것이 좋습니다. RSI는 종종 투기적인 시장의 과매매 상황을 식별하는 데 도움이 될 수 있습니다.
전략 원칙
동적 볼링밴드: 이 전략은 먼저 사용자 정의된 길이와 곱에 따라 상도 및 하도 볼링밴드를 계산한다. 그리고는 볼링밴드와 종결 가격 동적 조정과 결합하여 현재 볼링밴드의 값을 조정한다. 마지막으로, 가격이 현재 볼링밴드를 통과하면 다중 신호가 발생하며, 가격이 현재 볼링밴드를 통과하면 빈 신호가 발생한다.
RSI: 사용자가 RSI를 사용하여 신호를 생성하는 것을 선택하면, 이 전략은 RSI와 SMA를 계산하고 추가적인 상위 및 하위 신호를 생성하기 위해 그것들을 사용합니다. RSI를 사용하여 신호를 생성하는 필터 옵션이 true로 설정된 경우에만 RSI 기반 신호를 사용합니다.
그 다음, 이 전략은 선택한 거래 방향을 검사하고, 그에 따라 상장 또는 상장 입장에 진입한다. 거래 방향이 양방향으로 설정되어 있다면, 이 전략은 동시에 상장 및 상장 입장에 진입할 수 있다.
마지막으로, 종결 가격이 Present BollingBand을 통과했을 때 상장하고, 종결 가격이 Present BollingBand을 통과했을 때 상장합니다.
우위 분석
이 전략은 부린 밴드, RSI, SMA 지표의 장점을 결합하여 시장의 변동성에 적응하고, 동적으로 변동성을 포착하여 과매매 시 거래 신호를 생성합니다.
RSI 지표는 부린 띠 거래 신호를 보완하여 흔들리는 시장에서 잘못된 입장을 피합니다. 오직 더 많은 것을, 오직 짧은 것을 또는 양방향 거래를 선택하여 다른 시장 조건에 적응 할 수 있습니다.
파라미터는 사용자 정의 가능하며 개인 위험 선호도에 맞게 조정할 수 있다.
위험 분석
이 전략은 기술적인 지표에 의존하여 근본적인 변화에 대처할 수 없습니다.
부린밴드 파라미터를 잘못 설정하면 거래 신호가 너무 자주 또는 너무 희박하게 발생 할 수 있습니다.
양방향 거래의 위험성이 증가하여 상쇄 상장 손실에 주의해야 합니다.
리스크 조절을 위해 Stop Loss을 사용하는 것이 좋습니다.
최적화 방향
다른 지표 필터링 신호와 결합하여, 예를 들어 MACD。
더 많은 손실을 막는 전략
브린 띠와 RSI의 파라미터를 최적화한다.
거래 종류와 주기에 따라 변수를 조정한다.
실 디스크 최적화를 고려하고, 실제 상황에 맞게 파라미터를 조정한다.
요약하다
동적 파장을 포착 RSI-블린 밴드 전략은 브린 밴드, RSI 및 SMA 지표의 장점을 결합하여 브린을 동적으로 조정하여 시장의 변동을 포착하는 기술 지표 주도 전략입니다. 이 전략은 커스터마이징 및 최적화 공간이 넓지만 근본적인 변화를 예측할 수 없습니다. 실장 검증 효과를 제안하고, 필요한 경우 파라미터를 조정하거나 다른 지표와 결합하여 위험을 줄이십시오.
/*backtest
start: 2023-11-23 00:00:00
end: 2023-11-30 00:00:00
period: 15m
basePeriod: 5m
exchanges: [{"eid":"Futures_Binance","currency":"BTC_USDT"}]
*/

// This source code is subject to the terms of the Mozilla Public License 2.0 at https://mozilla.org/MPL/2.0/
// © PresentTrading

//@version=5
// Define the strategy settings
strategy('Volatility Capture RSI-Bollinger - Strategy [presentTrading]', overlay=true)

// Define the input parameters for the indicator
priceSource  = input.source(title='Source', defval=hlc3, group='presentBollingBand') // The price source to use
lengthParam   = input.int(50, 'lengthParam', minval=1, group='presentBollingBand') // The length of the moving average
multiplier = input.float(2.7183, 'Multiplier', minval=0.1, step=.1, group='presentBollingBand') // The multiplier for the ATR
useRSI = input.bool(true, 'Use RSI for signals', group='presentBollingBand') // Boolean input to decide whether to use RSI for signals
rsiPeriod = input.int(10, 'RSI Period', minval=1, group='presentBollingBand') // The period for the RSI calculation
smaPeriod = input.int(5, 'SMA Period', minval=1, group='presentBollingBand') // The period for the SMA calculation
boughtRange = input.float(55, 'Bought Range Level', minval=1, group='presentBollingBand') // The level for the bought range
soldRange = input.float(50, 'Sold Range Level', minval=1, group='presentBollingBand') // The level for the sold range

// Add a parameter for choosing Long or Short
tradeDirection = input.string("Both", "Trade Direction", options=["Long", "Short", "Both"], group='presentBollingBand') // Dropdown input for trade direction

// Calculate the bollingerBand
barIndex = bar_index // The current bar index
upperBollingerBand = ta.sma(high, lengthParam) + ta.stdev(high, lengthParam) * multiplier // Calculate the upper Bollinger Band
lowerBollingerBand = ta.sma(low, lengthParam) - ta.stdev(low, lengthParam) * multiplier // Calculate the lower Bollinger Band

var float presentBollingBand = na // Initialize the presentBollingBand variable
crossCount = 0 // Initialize the crossCount variable

// Calculate the buy and sell signals
longSignal1 = ta.crossover(priceSource, presentBollingBand) // Calculate the long signal
shortSignal1 = ta.crossunder(priceSource, presentBollingBand) // Calculate the short signal

// Calculate the RSI
rsiValue = ta.rsi(priceSource, rsiPeriod) // Calculate the RSI value
rsiSmaValue = ta.sma(rsiValue, smaPeriod) // Calculate the SMA of the RSI value

// Calculate the buy and sell signals
longSignal2 = rsiSmaValue > boughtRange // Calculate the long signal based on the RSI SMA
shortSignal2 = rsiSmaValue < soldRange // Calculate the short signal based on the RSI SMA

presentBollingBand := na(lowerBollingerBand) or na(upperBollingerBand)?0.0 : close>presentBollingBand?math.max(presentBollingBand,lowerBollingerBand) : close<presentBollingBand?math.min(presentBollingBand,upperBollingerBand) : 0.0


if (tradeDirection == "Long" or tradeDirection == "Both") and longSignal1 and (useRSI ? longSignal2 : true) // Use RSI for signals if useRSI is true
    presentBollingBand := lowerBollingerBand // If the trade direction is "Long" or "Both", and the long signal is true, and either useRSI is false or the long signal based on RSI is true, then assign the lowerBollingerBand to the presentBollingBand.
    strategy.entry("Long", strategy.long) // Enter a long position.

if (tradeDirection == "Short" or tradeDirection == "Both") and shortSignal1 and (useRSI ? shortSignal2 : true) // Use RSI for signals if useRSI is true
    presentBollingBand := upperBollingerBand // If the trade direction is "Short" or "Both", and the short signal is true, and either useRSI is false or the short signal based on RSI is true, then assign the upperBollingerBand to the presentBollingBand.
    strategy.entry("Short", strategy.short) // Enter a short position.

// Exit condition
if (strategy.position_size > 0 and ta.crossunder(close, presentBollingBand)) // If the strategy has a long position and the close price crosses under the presentBollingBand, then close the long position.
    strategy.close("Long")
if (strategy.position_size < 0 and ta.crossover(close, presentBollingBand)) // If the strategy has a short position and the close price crosses over the presentBollingBand, then close the short position.
    strategy.close("Short")

//~~ Plot
plot(presentBollingBand,"presentBollingBand", color=color.blue) // Plot the presentBollingBand on the chart.