골든 크로스와 데스 크로스 더블 이동 평균 거래 전략

개요
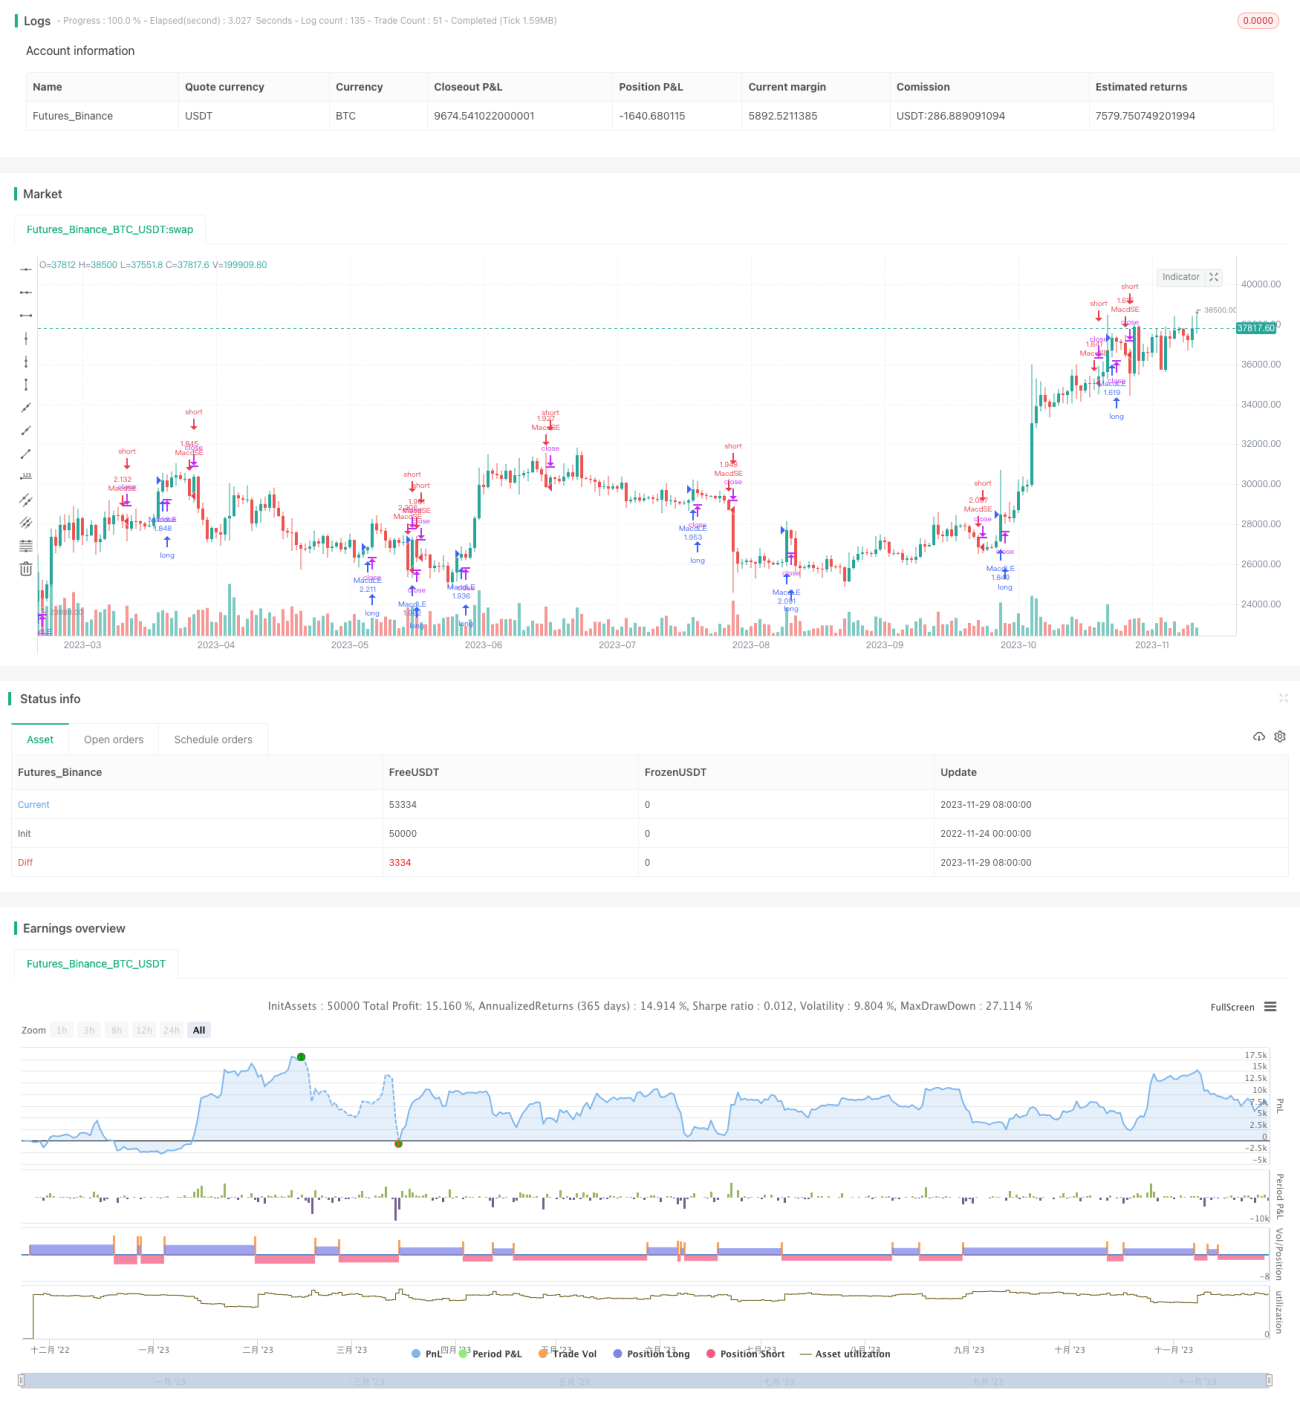
이중 평행 거래 전략은 다른 주기에서 지수 이동 평균을 계산하여 빠른 선과 느린 선을 형성하고 그들의 황금 포크와 죽은 포크 형태를 관찰하여 거래 신호를 생성합니다. 빠른 선이 아래에서 느린 선을 통과하면 더 많은 것을하고 빠른 선이 아래에서 느린 선을 통과하면 공백을 만듭니다. 이 전략은 평행 선의 트렌드 역점을 포착하며, 더 일반적인 트렌드 추적 전략입니다.
전략 원칙
양평선 거래 전략의 핵심 지표는 빠른 선과 느린 선을 계산하는 것이다. 빠른 선은 짧은 기간의 지수 이동 평균을 나타내고, 기본 파라미터는 12 일선이다. 느린 선은 긴 기간의 지수 이동 평균을 나타내고, 기본 파라미터는 26 일선이다. 지수 이동 평균의 계산 공식은 다음과 같다:
EMA(t) = (C(t) - EMA(t-1)) * SF + EMA(t-1)
그 중 C (t) 는 당일 종식 가격이고 SF는 부드러운 요인이다. 지수 이동 평균은 일반적인 수학 이동 평균과 다른 점은 지수 이동 평균은 최근의 데이터에 더 큰 무게를 부여하여 가격 변화에 더 빠르게 반응 할 수 있습니다.
이중 일률 전략의 거래 규칙은 다음과 같습니다.
- 빠른 선이 아래에서 느린 선을 통과하면 골든 크로스 골든 포크가 형성되어 더 많은 진출을합니다.
- 빠른 선이 위에서 아래로 느린 선을 통과할 때, 즉, 데드 크로스 사다리가 형성되고, 공백으로 진입한다.
- 빠른 선과 느린 선이 갈라지면 평상시에서 출발한다.
Capture는 평행선의 교차형을 감시하고, 시장의 수요와 공급 관계의 변화와 동향에 신속하게 반응하여 수익을 창출합니다.
우위 분석
쌍방향 거래 전략은 보다 성숙한 기술 지표 전략으로서 다음과 같은 장점을 가지고 있다:
- 이 아이디어는 명확하고, 이해하기 쉽고, 실행할 수 있습니다.
- 시장의 수요와 공급에 대한 판단이 정확하고, 승률이 높습니다.
- 시장의 소음을 효과적으로 필터링하여 주요 트렌드를 포착합니다.
- 다른 시장과 시간 프레임에 적용할 수 있습니다.
- 다른 기술 지표와 결합하여 전략을 강화할 수 있습니다.
- 자금 활용률이 높아서 큰 자금 요구에 부합합니다.
위험 분석
이중 일선 거래 전략에는 몇 가지 단점과 위험도 있습니다.
- "이런 상황에서는 시장이 급격하게 성장하는 것을 막을 수 없습니다.
- 이 경우, 거래가 매우 밀집되어서 잘못된 신호가 발생하고, 작은 흔들림이 자주 발생한다.
- 다양한 품종과 시간적 순환에 맞춰 최적화해야 합니다.
- 이 트렌드 전환의 합리적인 위치를 판단할 수 없습니다.
위와 같은 위험에 대해, 평균주기 파라미터를 조정하거나, 부가적인 필터를 도입하는 등의 방법을 통해 최적화하여, 전략이 더 안정되도록 할 수 있다.
최적화 방향
쌍방향 거래 전략은 다음과 같은 측면에서 최적화될 수 있다.
- 강하고 약한 동향을 판단하는 MACD 지표를 도입하여 약하고 흔들리는 동향의 잘못된 거래를 피하십시오.
- 트레이딩 볼륨을 높여서 트렌드 반전의 가짜 브레이크를 방지하는 확인 지표로 사용한다.
- 브린 라인, K 라인 등과 같은 다른 기술 지표와 결합하여 더 정확한 입출장 조건을 설정합니다.
- LSTM와 같은 기계 학습 방법을 사용하여 평균 선 변수를 자동으로 최적화하여 더 나은 시장 적응성을 달성합니다.
요약하다
쌍평선 거래 전략은 평선의 황금 포크와 죽은 포크 거래 기회를 포착하여 가격 추세 반전 지점을 판단하여 안정적인 수익을 달성합니다. 이 전략의 장점은 간결하고 명확하며, 자본 효율성이 높으며, 양적 입문을위한 최고의 전략입니다. 그러나 가짜 신호를 생성하는 것과 같은 특정 결점도 있습니다. 특정 품종과 거래 환경에 더 잘 적응하도록 더 많은 지표를 도입하여 최적화해야합니다.
- 1