이중 이동 평균 크로스오버 전략

저자:차오장, 날짜: 2023-12-01 18:18:16
태그:

img

전반적인 설명

이 전략은 이중 이동 평균 크로스오버 트렌드 다음 시스템을 기반으로 합니다. 빠른 단순 이동 평균 (SMA) 과 느린 가중 이동 평균 (VWMA) 을 결합하여 두 선이 서로 교차 할 때 거래 신호를 생성합니다.

빠른 SMA가 느린 VWMA를 넘을 때 구매 신호가 생성됩니다. 빠른 SMA가 느린 VWMA를 넘을 때 판매 신호가 생성됩니다. 전략은 위험을 제어하기 위해 스톱 로스 메커니즘을 사용합니다.

전략 논리

이 전략의 핵심 논리는 이중 이동 평균 크로스오버 시스템 (dual moving average crossover system) 에 있습니다. 구체적으로 다음과 같은 기술적 지표를 이용합니다.

  1. 단순 이동 평균 (SMA): 최근 평균 가격을 반영하는 지난 n 일 동안의 종료 가격의 수학적 평균.
  2. 가중화 이동 평균 (VWMA): 지난 n 일 동안의 종료 가격의 가중화 평균, 최근 가격에 더 높은 가중치를 부여하여 가격 변화에 더 빠르게 반응합니다.

빠른 SMA는 가격 변화에 빠르게 반응하기 위해 짧은 룩백 기간을 가지고 있으며 느린 VWMA는 평형화를 위해 더 긴 룩백 기간을 가지고 있습니다. 단기 및 장기 트렌드가 같은 방향으로 정렬되면 느린 VWMA 위에 빠른 SMA가 경로를 통과하면 구매 신호가 발생하고 아래로 경로를 통과하면 판매 신호가 발생합니다.

이 전략은 또한 스톱 로스 메커니즘을 설정합니다. 가격이 불리한 방향으로 움직일 때 시간적으로 손실을 줄입니다.

이점 분석

  1. 시장 트렌드 변화를 추적하는 데 신속하게 반응합니다.
  2. 효율적인 스톱 로스 메커니즘을 갖춘 좋은 마이너 다운 컨트롤
  3. 간단하고 직관적이며 이해하기 쉽고 실행하기 쉽습니다.
  4. 다양한 시장 환경에서 최적화 가능한 매개 변수

위험 분석

  1. 이중 MA 전략은 황소 시장에서 잘못된 신호를 주는 경향이 있습니다.
  2. 부적절한 매개 변수 조정으로 인해 손실이 발생할 수 있습니다.
  3. 때때로 플래시 충돌로 인해 손실이 발생할 수 있습니다.

위험 관리:

  1. 확인을 위해 트렌드 필터링 지표를 사용
  2. 매개 변수 설정을 최적화
  3. 단일 손실을 합리적으로 통제하기 위한 스톱 로스 전략을 채택

최적화 방향

이 전략은 다음과 같은 측면에서 향상될 수 있습니다.

  1. 신호의 정확성을 높이기 위해 RSI, 볼린저 밴드와 같은 다른 지표를 통합
  2. 주기에 걸쳐 이동 평균의 길이를 최적화
  3. 부피 지표 결합, 중요한 자본 흐름이 있는 지점에서의 거래
  4. 최적을 찾기 위해 백테스트 결과를 기반으로 매개 변수를 조정
  5. 동적 스톱 로스 사용, 시장 변동성에 따라 스톱을 조정

결론

결론적으로, 이것은 매우 실용적인 트렌드 다음 전략이다. 직관적인 이중 이동 평균 크로스오버를 사용하여 거래 신호를 생성하고, 빠르고 느린 이동 평균의 조정으로 트렌드 변화를 효과적으로 캡처합니다. 스톱 로스 메커니즘은 또한 좋은 위험 통제를 보장합니다. 보완적 인 지표와 매개 변수 최적화로 전략은 더 나은 거래 성능을 달성 할 수 있습니다.


/*backtest
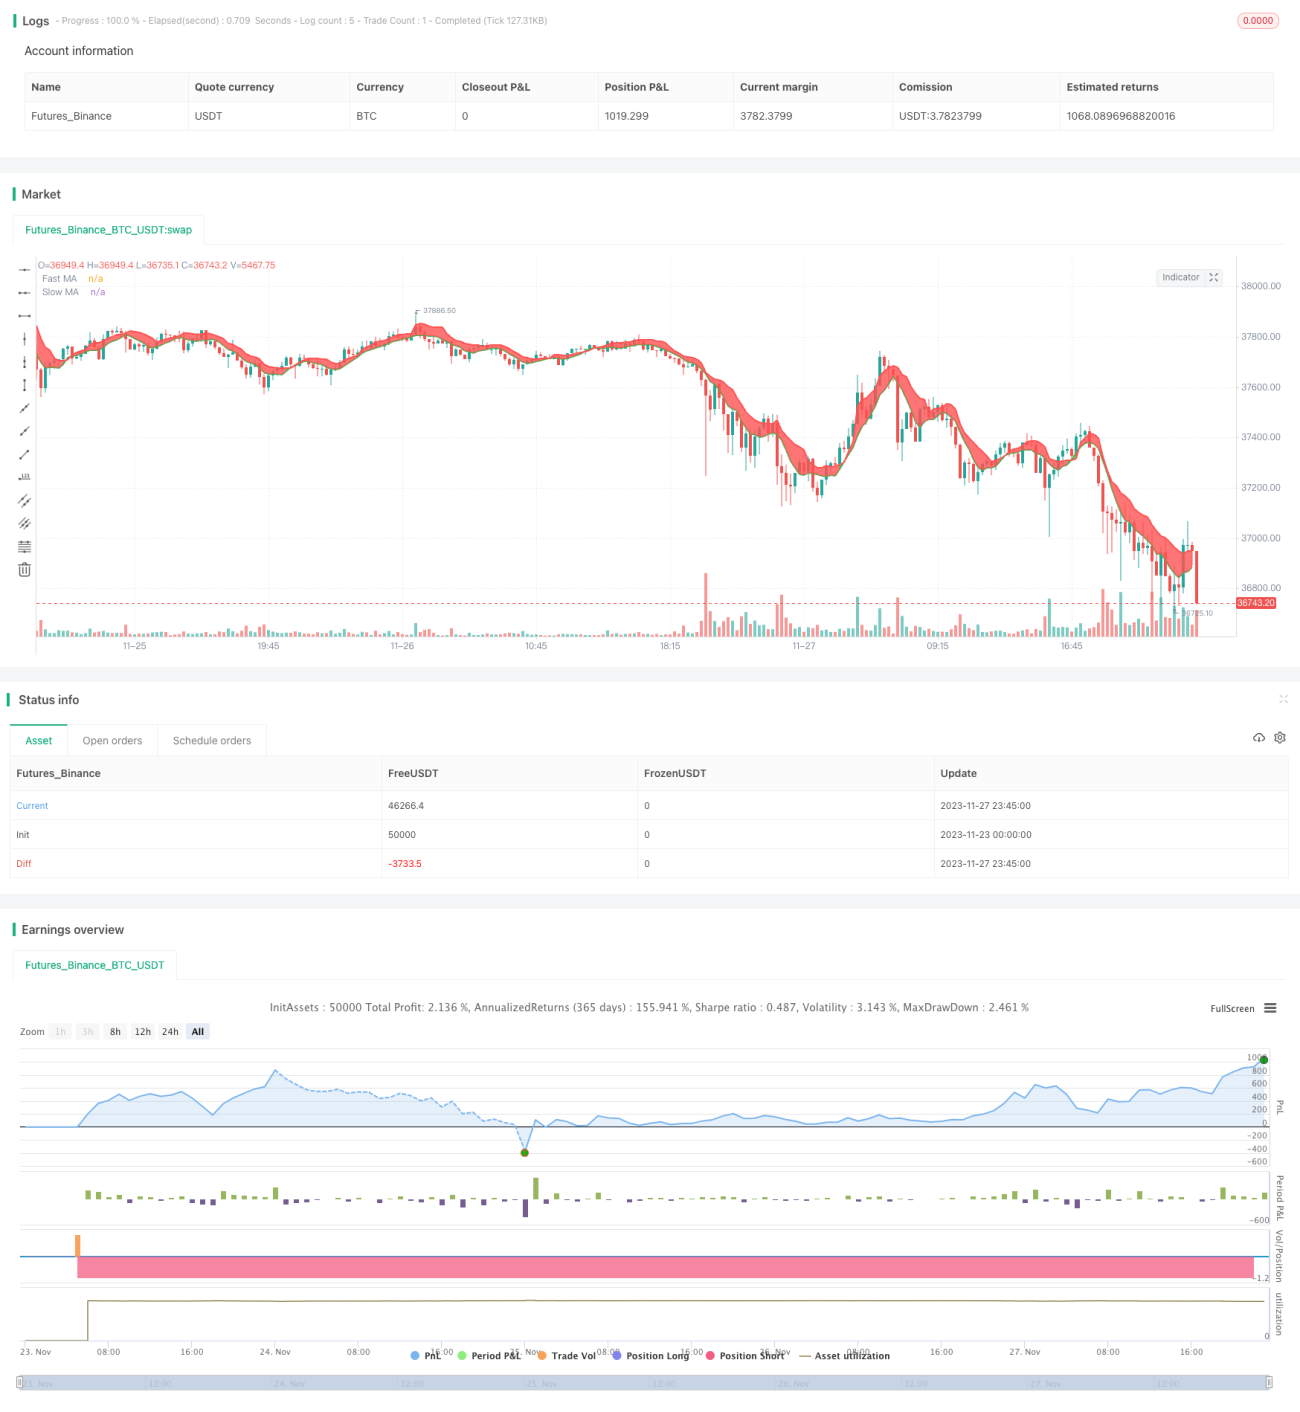
start: 2023-11-23 00:00:00
end: 2023-11-28 00:00:00
period: 15m
basePeriod: 5m
exchanges: [{"eid":"Futures_Binance","currency":"BTC_USDT"}]
*/

//@version=4
//strategy(title="Bitlinc Entry v0.1 VWMA / SMA / MRSI SQQQ 94M", overlay=true, initial_capital=10000, currency='USD')

strategy(title="Bitlinc Entry v0.1 VWMA / SMA / MRSI SQQQ 94M", overlay=true)

// Credit goes to this developer for the "Date Range Code"
// https://www.tradingview.com/script/62hUcP6O-How-To-Set-Backtest-Date-Range/

// === GENERAL INPUTS ===
// short ma
maFastSource   = input(defval = close, title = "Simple MA Source")
maFastLength   = input(defval = 6, title = "Simple MA Length", minval = 1)
// long ma
maSlowSource   = input(defval = high, title = "VW MA Source")
maSlowLength   = input(defval = 7, title = "VW MA Period", minval = 1)


// === SERIES SETUP ===
// a couple of ma's...
maFast = sma(maFastSource, maFastLength)
maSlow = vwma(maSlowSource, maSlowLength)


// === PLOTTING ===
fast = plot(maFast, title = "Fast MA", color = color.green, linewidth = 2, style = plot.style_line, transp = 30)
slow = plot(maSlow, title = "Slow MA", color = color.red, linewidth = 2, style = plot.style_line, transp = 30)

// === INPUT BACKTEST RANGE ===
FromMonth = input(defval = 1, title = "From Month", minval = 1, maxval = 12)
FromDay   = input(defval = 1, title = "From Day", minval = 1, maxval = 31)
FromYear  = input(defval = 2018, title = "From Year", minval = 2017)
ToMonth   = input(defval = 1, title = "To Month", minval = 1, maxval = 12)
ToDay     = input(defval = 1, title = "To Day", minval = 1, maxval = 31)
ToYear    = input(defval = 9999, title = "To Year", minval = 2017)

// === FUNCTION EXAMPLE ===
start     = timestamp(FromYear, FromMonth, FromDay, 00, 00)  // backtest start window
finish    = timestamp(ToYear, ToMonth, ToDay, 23, 59)        // backtest finish window
window()  => time >= start and time <= finish ? true : false // create function "within window of time"

// === LOGIC ===
enterLong = crossover(maFast, maSlow)
exitLong = crossover(maSlow, maFast)
//enterLong = crossover(maSlow, maFast)
//exitLong = crossover(maFast, maSlow)

// Entry //
strategy.entry(id="Long Entry", long=true, when=window() and enterLong)
strategy.entry(id="Short Entry", long=false, when=window() and exitLong)

// === FILL ====
fill(fast, slow, color = maFast > maSlow ? color.green : color.red)

// === MRSI ===
//
//

basis = rsi(close, input(50))

ma1 = ema(basis, input(2))
ma2 = ema(basis, input(27))

oversold = input(32.6)
overbought = input(63)

//plot(ma1, title="RSI EMA1", color=blue)
//plot(ma2, title="RSI EMA2", color=yellow)

obhist = ma1 >= overbought ? ma1 : overbought
oshist = ma1 <= oversold ? ma1 : oversold

//plot(obhist, title="Overbought Highligth", style=columns, color=color.maroon, histbase=overbought)
//plot(oshist, title="Oversold Highligth", style=columns, color=color.yellow, histbase=oversold)

//i1 = hline(oversold, title="Oversold Level", color=white)
//i2 = hline(overbought, title="Overbought Level", color=white)

//fill(i1, i2, color=olive, transp=100)

// === LOGIC ===
enterLongMrsi = crossover(ma1, oversold)
exitLongMrsi = crossover(ma1, overbought)

// Entry //
strategy.entry(id="MRSI Long Entry", long=true, when=window() and enterLongMrsi)
strategy.entry(id="MRSI Short Entry", long=false, when=window() and exitLongMrsi)

//hline(50, title="50 Level", color=white)

더 많은