
트래킹 라인 전략은 브린 띠 지표와 평균 실제 변동 범위 ((ATR) 를 기반으로 한 트렌드 추적 전략이다. 그것은 동적으로 트렌드 판단 라인을 조정하여 브린 띠를 돌파 할 때 위쪽으로 조정하고 브린 띠를 돌파 할 때 아래로 조정하여 트렌드를 판단하고 추적합니다.
이 전략은 먼저 부린띠의 상하 트레일과 평균 실제 변동 범위를 계산한다. 그리고 가격이 부린띠의 상하 트레일 또는 하하 트레일을 뚫었는지 판단한다.
가격이 경로를 돌파할 때, ATR 필터를 켜면, 트렌드 판단 라인을 최저 가격으로 설정하고 ATR을 다. ATR 필터를 켜지 않으면 최저 가격으로 직접 설정한다.
가격이 하락할 때, ATR 필터를 켜면 트렌드 판단 라인을 최고 가격으로 설정하고 ATR을 추가합니다. ATR 필터를 켜지 않으면 최고 가격으로 직접 설정합니다.
이렇게하면, 트렌드 판단선은 가격의 브레이크 브린을 타고 내려가는 궤도에 따라 동적으로 조정될 수 있으며, 이를 통해 트렌드에 대한 판단을 가능하게 한다.
현재 트렌드 판단선이 이전 트렌드 판단선보다 높으면 현재 상승 추세에 있음을 나타냅니다. 현재 트렌드 판단선이 이전 트렌드 판단선보다 낮으면 현재 하락 추세에 있음을 나타냅니다.
트렌드 판단에 따라, 이 전략은 더 많은 하위 하위 작업을 수행 할 수 있습니다.
파라미터 조정, 스톱을 도입하여 일부 위험을 회피 할 수 있습니다. 또한 다른 지표와 결합하여 필터링을 통해 돌파의 효율성을 높일 수 있습니다.
트래킹 라인 전략은 변동적인 상황에서 가격 추세를 포착하는 데 전념하며, 효과적인 트렌드 추적 전략이다. 매개 변수를 조정하고 최적화하면 좋은 수익을 얻을 수 있다. 그러나 또한 위험 제어 중지 및 가짜 돌파구를 방지하는 것을 고려해야합니다. 이 전략을 다른 지표 또는 전략 조합과 함께 사용하는 것이 권장되며, 수익률을 더욱 향상시킬 수 있다.
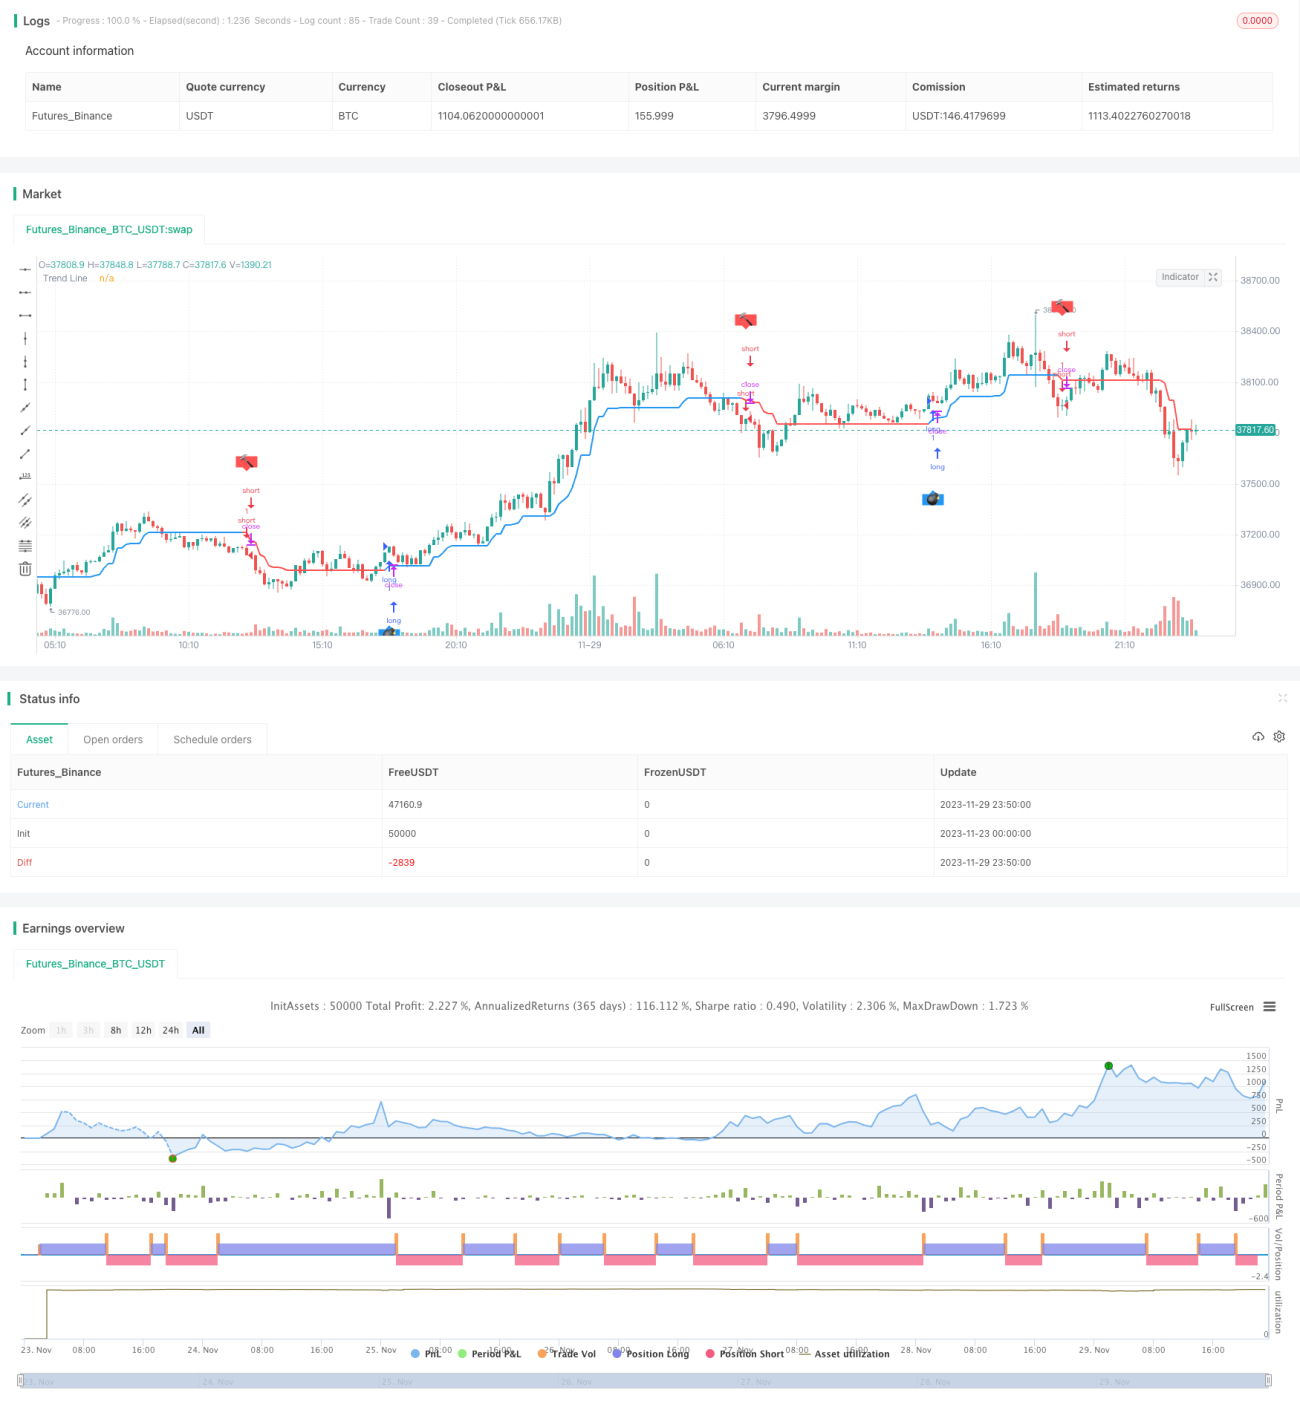
/*backtest
start: 2023-11-23 00:00:00
end: 2023-11-30 00:00:00
period: 10m
basePeriod: 1m
exchanges: [{"eid":"Futures_Binance","currency":"BTC_USDT"}]
*/
// © Dreadblitz
//@version=4
//
// ▒▒▒▒▒▒▒▒▒▒▒▒▒▒▒▒▒▒▒▒▒▒▒▒▒▒▒▒▒▒▒▒▒▒▒▒▒▒▒▒▒▒▒▒▒▒▒▒▒▒▒▒▒▒▒▒▒▒▒▒▒▒▒▒▒▒▒▒▒▒▒▒▒▒▒▒▒▒▒▒▒▒▒▒▒▒▒▒▒▒▒▒▒▒▒▒▒▒▒▒▒▒▒▒▒▒▒▒▒▒▒▒▒▒ //
strategy(title = " Strategy Follow Line Indicator ",
shorttitle = "S-FLI",
overlay = true,
precision = 8,
calc_on_order_fills = true,
calc_on_every_tick = true,
backtest_fill_limits_assumption = 0,
default_qty_type = strategy.fixed,
default_qty_value = 2,
initial_capital = 10000,
pyramiding=1,
currency = currency.USD,
linktoseries = true)
//
// ▒▒▒▒▒▒▒▒▒▒▒▒▒▒▒▒▒▒▒▒▒▒▒▒▒▒▒▒▒▒▒▒▒▒▒▒▒▒▒▒▒▒▒▒▒▒▒▒▒▒▒▒▒▒▒▒▒▒▒▒▒▒▒▒▒▒▒▒▒▒▒▒▒▒▒▒▒▒▒▒▒▒▒▒▒▒▒▒▒▒▒▒▒▒▒▒▒▒▒▒▒▒▒▒▒▒▒▒▒▒▒▒▒▒ //
backTestSectionFrom = input(title = "═══════════════ From ═══════════════", defval = true, type = input.bool)
FromMonth = input(defval = 1, title = "Month", minval = 1)
FromDay = input(defval = 1, title = "Day", minval = 1)
FromYear = input(defval = 2014, title = "Year", minval = 2000)
backTestSectionTo = input(title = "════════════════ To ════════════════", defval = true, type = input.bool)
ToMonth = input(defval = 31, title = "Month", minval = 1)
ToDay = input(defval = 12, title = "Day", minval = 1)
ToYear = input(defval = 9999, title = "Year", minval = 2000)
Config = input(title = "══════════════ Config ══════════════", defval = true, type = input.bool)
BBperiod = input(defval = 21, title = "BB Period", type = input.integer, minval = 1)
BBdeviations = input(defval = 1.00, title = "BB Deviations", type = input.float, minval = 0.1, step=0.05)
UseATRfilter = input(defval = true, title = "ATR Filter", type = input.bool)
ATRperiod = input(defval = 5, title = "ATR Period", type = input.integer, minval = 1)
hl = input(defval = false, title = "Hide Labels", type = input.bool)
backTestPeriod() => true
//
//
// ▒▒▒▒▒▒▒▒▒▒▒▒▒▒▒▒▒▒▒▒▒▒▒▒▒▒▒▒▒▒▒▒▒▒▒▒▒▒▒▒▒▒▒▒▒▒▒▒▒▒▒▒▒▒▒▒▒▒▒▒▒▒▒▒▒▒▒▒▒▒▒▒▒▒▒▒▒▒▒▒▒▒▒▒▒▒▒▒▒▒▒▒▒▒▒▒▒▒▒▒▒▒▒▒▒▒▒▒▒▒▒▒▒▒ //
BBUpper=sma (close,BBperiod)+stdev(close, BBperiod)*BBdeviations
BBLower=sma (close,BBperiod)-stdev(close, BBperiod)*BBdeviations
//
TrendLine = 0.0
iTrend = 0.0
buy = 0.0
sell = 0.0
//
BBSignal = close>BBUpper? 1 : close<BBLower? -1 : 0
//
if BBSignal == 1 and UseATRfilter == 1
TrendLine:=low-atr(ATRperiod)
if TrendLine<TrendLine[1]
TrendLine:=TrendLine[1]
if BBSignal == -1 and UseATRfilter == 1
TrendLine:=high+atr(ATRperiod)
if TrendLine>TrendLine[1]
TrendLine:=TrendLine[1]
if BBSignal == 0 and UseATRfilter == 1
TrendLine:=TrendLine[1]
//
if BBSignal == 1 and UseATRfilter == 0
TrendLine:=low
if TrendLine<TrendLine[1]
TrendLine:=TrendLine[1]
if BBSignal == -1 and UseATRfilter == 0
TrendLine:=high
if TrendLine>TrendLine[1]
TrendLine:=TrendLine[1]
if BBSignal == 0 and UseATRfilter == 0
TrendLine:=TrendLine[1]
//
iTrend:=iTrend[1]
if TrendLine>TrendLine[1]
iTrend:=1
if TrendLine<TrendLine[1]
iTrend:=-1
//
buy:=iTrend[1]==-1 and iTrend==1 ? 1 : na
sell:=iTrend[1]==1 and iTrend==-1? 1 : na
//
plot(TrendLine, color=iTrend > 0?color.blue:color.red ,style=plot.style_line,linewidth=2,transp=0,title="Trend Line")
plotshape(buy == 1 and hl == false? TrendLine-atr(8) :na, text='💣', style= shape.labelup, location=location.absolute, color=color.blue, textcolor=color.white, offset=0, transp=0,size=size.auto)
plotshape(sell == 1 and hl == false ?TrendLine+atr(8):na, text='🔨', style=shape.labeldown, location=location.absolute, color=color.red, textcolor=color.white, offset=0, transp=0,size=size.auto)
// Strategy Entry
if (backTestPeriod())
strategy.entry("long", true, 1, when = buy == 1)
strategy.entry("short", false, 1, when = sell == 1)