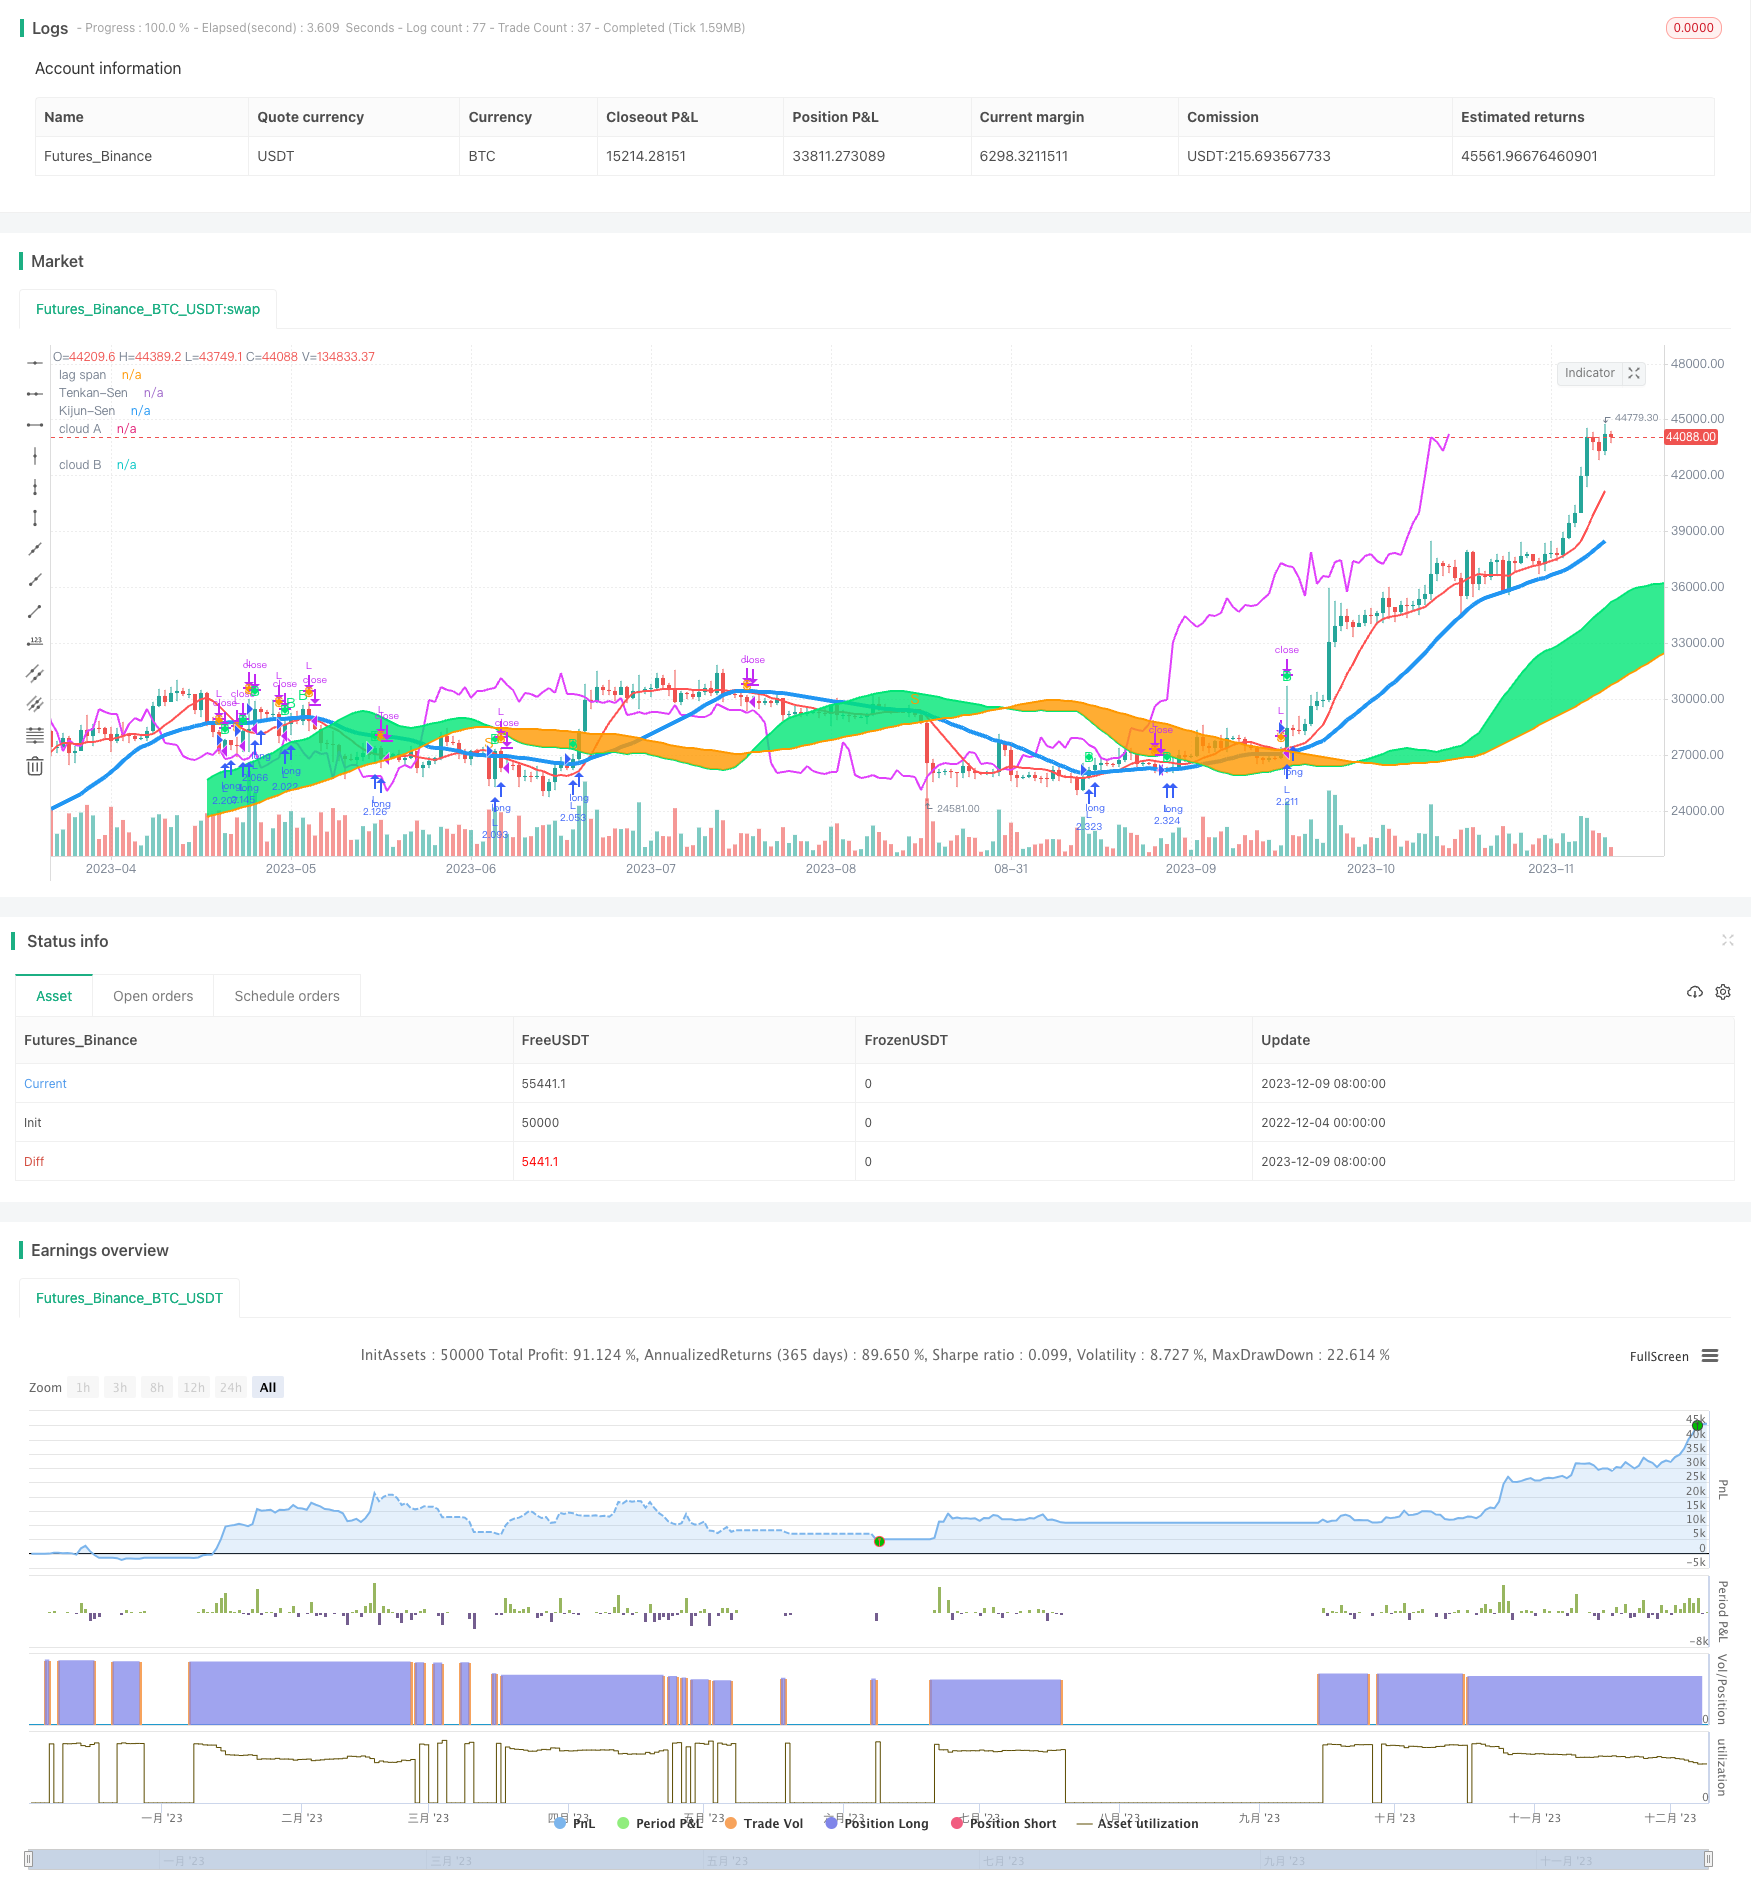
개요
이 전략은 이치모쿠 기술 지표에 기반하여 트렌드 추적과 균형 돌파를 사용하는 거래 방식을 사용하여 중장선 가격 추세를 포착하여 안정적인 수익을 창출합니다.
전략 원칙
전략은 첫눈의 균형표의 다섯 줄 - 전환선, 기준선, 전방선, 선도선, 그리고 지연선 -을 사용하여 가격 경향과 지원 저항을 판단한다. 구체적인 판단 규칙은 다음과 같다:
- 종결 가격에서 기준선을 통과하고 기준선이 비정상적으로 움직일 때, 구매 신호를 생성한다.
- 종결 가격 아래에서 기준선을 통과하고 기준선이 비정상적으로 움직일 때, 판매 신호를 생성한다.
- 매출액이 클라우드 보다 높을 때, 유동성이 좋으며, 창고가 허용된다.
- 매출액이 낮아지는 경우, 매출액이 낮아지는 경우, 매출액이 낮아지는 경우, 매출액이 낮아지는 경우, 매출액이 낮아지는 경우, 매출액이 낮아지는 경우, 매출액이 낮아지는 경우, 매출액이 낮아지는 경우, 매출액이 낮아지는 경우.
- 지연선 상의 종식값을 통과하면 구매 신호가 발생한다.
- 지연선 아래의 상쇄 가격 뚫림은 판매 신호를 발생시킨다.
상술한 거래 신호를 종합적으로 판단한 후 최종 입시 시점을 결정한다.
우위 분석
이 전략은 다음과 같은 장점을 가지고 있습니다.
- 초점 균형 표를 사용하여 트렌드를 판단하고, 시장 소음을 필터링하여 중·장선 트렌드를 잠금할 수 있다.
- 클라우드 과 함께 유동성을 판단하여 포지션 위험을 피할 수 있습니다.
- 지연선은 확인 신호로, 가짜 돌파구를 피한다.
- 규칙은 간단하고 명확하며 실행하기 쉽습니다.
위험 분석
이 전략에는 다음과 같은 위험도 있습니다.
- 잘못된 매개 변수 설정으로 인해 거래 기회를 놓칠 수 있습니다.
- 트렌드가 돌연변이되면, 지연을 판단할 수 없고, 적시에 손실을 막을 수 없다.
- 다자 포지션은 손실 위험이 높습니다.
위와 같은 위험에는 최적화 파라미터를 설정하고, 다른 지표와 결합하여 트렌드 변화를 판단하고, 엄격하게 중지하여 해결할 수 있다.
최적화 방향
이 전략은 다음과 같은 부분에서 최적화될 수 있습니다.
- 첫 번째 균형 표의 파라미터를 최적화하여 최적의 조합을 찾습니다.
- 가격 지표 필터링을 추가하여 트렌드 오차를 방지하십시오.
- 변동률 지표와 함께 판단하는 전환점.
- 트렌드 상태를 판단하는 기계학습 모형에 가입하십시오.
요약하다
이 전략은 가격 추세와 유동성을 판단하기 위해 일회성 평형 표를 사용하며, 추세 추적 모드를 채택하여, 중장선 추세를 잡는 잡음 필터링을 효과적으로 수행 할 수 있으며, 회수 위험은 낮으며, 중장선 보유에 적합합니다. 매개 변수 설정을 추가적으로 최적화하고 보조 필터링 지표를 추가하고, 추세 전환 신호를 채굴함으로써 전략의 수익 인자를 향상시킬 수 있습니다.
전략 소스 코드
/*backtest
start: 2022-12-04 00:00:00
end: 2023-12-10 00:00:00
period: 1d
basePeriod: 1h
exchanges: [{"eid":"Futures_Binance","currency":"BTC_USDT"}]
*/

//@version=3
strategy("My Ichimoku Strat", overlay=true,default_qty_type=strategy.percent_of_equity, default_qty_value=100, initial_capital=1000, currency=currency.EUR)
// === BACKTEST RANGE ===
FromMonth = input(defval = 1, title = "From Month", minval = 1)
FromDay   = input(defval = 1, title = "From Day", minval = 1)
FromYear  = input(defval = 2017, title = "From Year", minval = 2014)
ToMonth   = input(defval = 1, title = "To Month", minval = 1)
ToDay     = input(defval = 1, title = "To Day", minval = 1)
ToYear    = input(defval = 9999, title = "To Year", minval = 2014)

// === SERIES SETUP ===
//**** Inputs *******
KijunSenLag = input(6,title="KijunSen Lag",minval=1)

//Kijun-sen
//Support resistance line, buy signal when price crosses it
KijunSen = sma((high+low)/2,26)
buy2 = crossover(close,KijunSen) and (rising(KijunSen,KijunSenLag) or falling(KijunSen,KijunSenLag))
sell2= crossunder(close,KijunSen) and (rising(KijunSen,KijunSenLag) or falling(KijunSen,KijunSenLag))


//Tenkan-Sen
TenkanSen = sma((high+low)/2,9)

//Senkou Span A
SenkouSpanA = (KijunSen + TenkanSen)/2

//Senkou Span B
SenkouSpanB = sma((high+low)/2,52)

//Cloud conditions : ignore buy if price is under the cloud
// Huge cloud means safe support and resistance. Little cloud means danger.
buy3 = close > SenkouSpanA and close > SenkouSpanB
sell3 = close < SenkouSpanA and close < SenkouSpanB


//Chikou Span
//Buy signal : crossover(ChikouSpan,close)
//Sell Signal : crossunder(ChikouSpan,close)
ChikouSpan = close
buy1=crossover(ChikouSpan,close[26])
sell1=crossunder(ChikouSpan,close[26])

plotshape(buy1,style=shape.diamond,color=lime,size=size.small)
plotshape(sell1,style=shape.diamond,color=orange,size=size.small)

//Alerts

buyCompteur = -1
buyCompteur := nz(buyCompteur[1],-1)
buyCompteur := buy2 or buy3 ? 1 : buyCompteur
buyCompteur := buyCompteur > 0 ? buyCompteur + 1 : buyCompteur
buyCompteur := sell2 or sell3 ? -1 : buyCompteur

sellCompteur = -1
sellCompteur := nz(sellCompteur[1],-1)
sellCompteur := sell2 or sell3 ? 1 : sellCompteur
sellCompteur := sellCompteur > 0 ? sellCompteur + 1 : sellCompteur
sellCompteur := buy2 or buy3 ? -1 : sellCompteur

sell= sell2 and sell3 or (sell1 and buyCompteur <= 8)
buy=buy2 and buy3 or (buy1 and sellCompteur <=8)
plotchar(buy,char='B',size=size.small,color=lime)
plotchar(sell,char='S',size=size.small,color=orange)

//plots
plot(KijunSen,title="Kijun-Sen",color=blue,linewidth=4)
plot(TenkanSen,title="Tenkan-Sen",color=red,linewidth=2)
cloudA = plot(SenkouSpanA,title="cloud A", color=lime,offset=26,linewidth=2)
cloudB = plot(SenkouSpanB,title="cloud B", color=orange,offset=26,linewidth=2)
plot(ChikouSpan,title="lag span",color=fuchsia, linewidth=2,offset=-26)
//plot()
fill(cloudA,cloudB,color=SenkouSpanA>SenkouSpanB?lime:orange)
//plot(close,color=silver,linewidth=4)

// === ALERTS ===
strategy.entry("L", strategy.long, when=(buy and (time > timestamp(FromYear, FromMonth, FromDay, 00, 00)) and (time < timestamp(ToYear, ToMonth, ToDay, 23, 59))))
strategy.close("L", when=(sell and (time < timestamp(ToYear, ToMonth, ToDay, 23, 59))))