EMA와 ATR 손절매를 기반으로 한 추세 추종 전략

1
Follow
1778
Followers
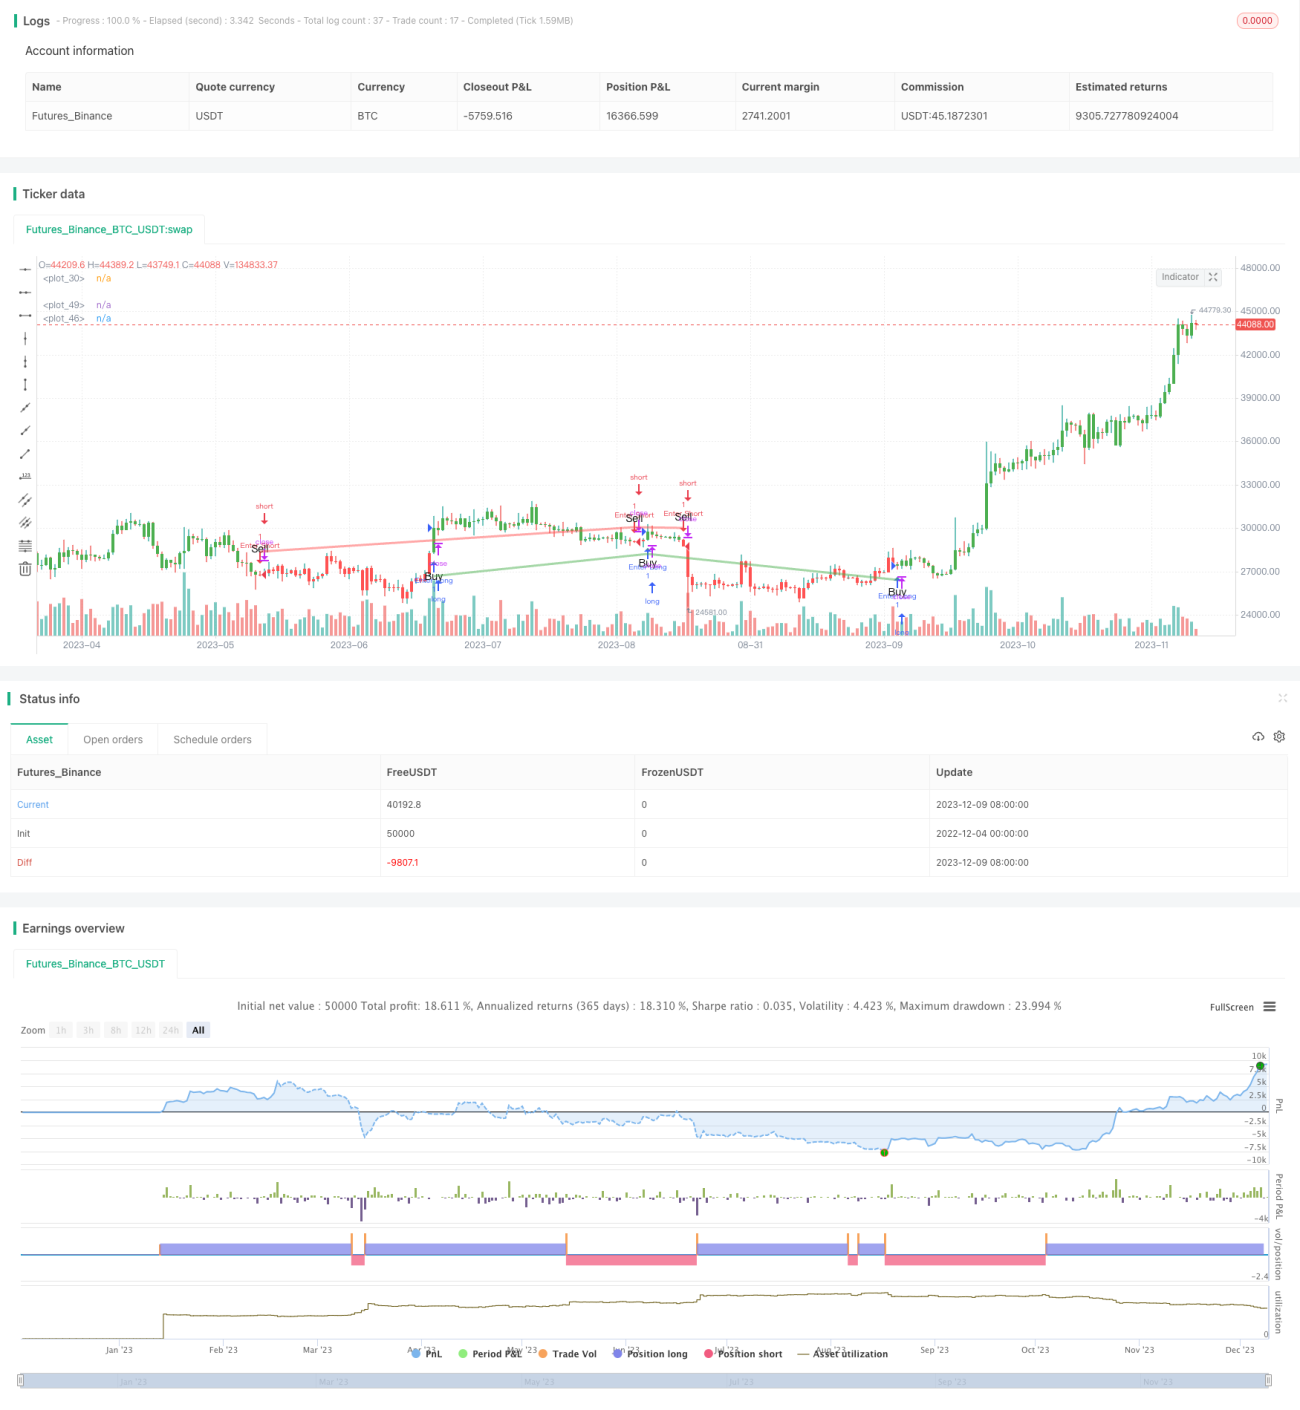
개요
이 전략은 EMA 평평선 golden cross를 사용하여 거래 신호를 생성합니다. 즉, 빠른 EMA 라인을 가로질러 느린 EMA 라인을 가로질러 구매 신호를 생성하고, 빠른 EMA 라인을 가로질러 느린 EMA 라인을 가로질러 판매 신호를 생성합니다.
전략 원칙
- 정의 빠른 EMA 평균주기는 13이고, 느린 EMA 평균주기는 48。
- 빠른 EMA 라인이 느린 EMA 라인을 통과하면 구매 신호가 발생하고, 빠른 EMA 라인이 느린 EMA 라인을 통과하면 판매 신호가 발생한다.
- ta.crossover 및 ta.crossunder 함수를 통해 평선 금강포크를 판단한다.
- ATR 지표를 사용하여 동적 스톱피드를 계산하고, 스톱피드 거리가 클로즈의 1.5배인 ATR。
- 색상 변화, 매매 표시, 스톱 라인을 통해 거래 신호와 스톱 지점을 직관적으로 표시한다.
전략적 강점 분석
- EMA 평균선에 기반한 황금 포크 도드 포크는 시장의 주요 트렌드를 놓치지 않도록 신호를 생성하고 수익은 상당히 높습니다.
- ATR의 동적 추적 상쇄는 충분한 상쇄 수익을 보장하고 철회 위험을 통제하며 전체적인 위험 수익은 균형 잡힌다.
- 직관적인 신호 표시와 손해 방지 표시, 조작이 간단하며, 대부분의 사람들에게 적합하다.
- 조정 가능한 매개 변수가 적고, 쉽게 익히고 최적화할 수 있다.
전략적 위험 분석
- 급격한 하락으로 인한 급격한 하락으로 인한 급격한 하락으로 인한 급격한 하락으로 인한 급격한 하락으로 인한 급격한 하락
- 지진상태에서 빈번하게 무효 신호가 발생할 수 있다.
- 매개 변수 설정이 잘못되면 너무 강렬하게 진입하거나 너무 느슨하게 막힐 수 있다.
- EMA 변수와 ATR 변수를 적절히 최적화해야 한다.
해결책:
- ATR 배수를 적절히 느슨하게 하여, 최근 최고점으로부터 약간의 완충을 보장할 수 있다.
- 신호 발생 후 확인 메커니즘이 고려될 수 있습니다. 예를 들어 가격 파격 전 최고점 등이 있습니다.
- 여러 가지 시장 상황을 고려하여 매개 변수 최적화를 권장합니다.
전략 최적화 방향
- 다양한 변수 조합을 테스트하여 최적의 변수를 찾을 수 있다.
- 다른 지표들을 추가하여 신호 필터링을 고려할 수 있습니다. 예를 들어, 거래량 지표, 변동률 지표 등으로 신호 품질을 향상시킬 수 있습니다.
- 주요 트렌드를 더 잘 잡기 위해 EMA 파라미터를 대차 트렌드에 따라 조정할 수 있습니다.
- 동적으로 ATR 중지 배수를 조정하고, 추세 상황에서 중지 범위를 확장하는 것을 고려할 수 있습니다.
- 기계 학습 알고리즘과 결합하여 최적화 변수를 조정할 수 있다.
요약하다
이 전략은 전반적으로 간단하고 사용하기 쉽고, EMA 평평선에 기반하여 신호를 생성하고, 순차적으로 ATR 지표 추적을 추가하여 위험을 효과적으로 제어 할 수 있습니다. 허위 신호가 있기는 하지만, 주요 추세를 포착하는 능력이 강하고, 수익은 안정적이며, 정량 거래의 기본 전략 중 하나입니다. 변수 최적화 및 기능 확장으로도 많은 개선의 여지가 있으며, 깊이있는 연구를 할 가치가 있습니다.
Source
Pine
/*backtest
start: 2022-12-04 00:00:00
end: 2023-12-10 00:00:00
period: 1d
basePeriod: 1h
exchanges: [{"eid":"Futures_Binance","currency":"BTC_USDT"}]
*/

// This source code is subject to the terms of the Mozilla Public License 2.0 at https://mozilla.org/MPL/2.0/
// © byee322

/// This strategy uses the EMA to generate buy and sell signals with a 1.5x ATR stop lossStrategy parameters
Related strategies
Comment
All comments (0)
No data
- 1