
이 전략은 일정 주기 내의 가격 극대 가치 포인트와 극소 가치 포인트를 계산하여 상하 궤도를 형성하고, 현재 가격이 상하 궤도 위에 있거나 하하 궤도 아래에 있을 때 판단하여, 긴 포지션 또는 짧은 포지션 작업을 수행한다. 전략은 주로 가격의 경향성을 결정하고, 추세가 강화될 때 거래한다.
이 전략의 핵심 지표는 일정 주기 내의 가격 극대값점과 극소값점을 계산하는 것이다. 구체적인 계산 방법은 다음과 같다.
상반선: 왼쪽에서 오른쪽으로 스캔하는 사이클의 K선에서 극대값의 최고점을 찾아, 그 왼쪽의 1차 K선에서 가장 왼쪽으로 그리고 오른쪽에서 마지막 1차 K선까지 모두 극대값의 최고점보다 낮다는 것을 판단하고, 만약 그렇다면 그 점을 구간 꼭대기로 확인한다.
하단 레일: 왼쪽에서 오른쪽으로 스캔하는 주기 내의 K 선에서 극소수 하위치를 찾아 그 왼쪽의 1차 K 선이 가장 왼쪽으로 그리고 오른쪽의 마지막 1차 K 선이 그 극소수 하위점보다 높는지 판단하고, 만약 그렇다면 그 지점을 구간 하위점으로 확인한다.
이러한 계산을 반복하면 일정 주기 동안의 가격의 상하 궤도를 얻을 수 있다. 가격이 상하 궤도를 통과할 때 더하고, 하하 궤도를 통과할 때 공백을 만든다. 이렇게하면 가격 극한점 기반의 추세를 결정하는 거래 전략이 형성된다.
이 전략은 트렌드를 판단하는 방식이 원시적으로 직접적이며, 가격 극한값을 통해 트렌드 강화된 부분을 판단하여, 충격 시나리오를 효과적으로 필터링하여, 충격 속에서 거래하는 것을 피할 수 있다. 전략 거래 신호가 생성되는 위치가 상대적으로 우수하며, 트렌드 추적이 쉽게 형성된다. 또한, 전략 신호를 취하는 방식이 상대적으로 엄격하여, 잘못된 신호를 줄일 수 있다.
이 전략은 신호를 취하는 것이 엄격하며, 더 많은 거래 기회를 놓칠 수 있다. 또한, 극한점은 일정 시간 동안 축적되어 형성될 필요가 있으며, 비교가 지연되어 적절한 최적화 매개 변수가 필요하다. 매개 변수가 적절하지 않은 경우, 잘못된 신호가 발생할 가능성이 높다.
극한점 판단의 엄격함을 적절히 줄여서 일정 정도의 변동성을 허용하여 잘못된 판단의 위험을 줄일 수 있다. 또한, 다른 지표와 결합하여 확인을 할 수 있어 잘못된 신호를 피할 수 있다.
이 전략은 상승과 하락의 주기를 적절히 최적화하여 트렌드를 더 잘 포착할 수 있다. 또한 극한점을 판단할 때 스캔 간격도 조정할 수 있다.
거래 기회를 놓칠 수 있는 가능성을 줄이기 위해 극한점 판단 조건을 적절히 완화하여 일정 정도의 변동성을 허용할 수 있다.
다른 지표와 결합하여 확인을 시도할 수 있습니다. 예를 들어, 양력 지표, 이동 평균 등과 같이, 단일 지표 판단으로 인해 발생하는 잘못된 신호 위험을 피합니다.
이 전략은 가격 극한점을 통해 가격 트렌드 특성을 판단하는 방식으로 비교적 직접적으로 효과적이며, 효율적으로 흔들림을 필터링하고, 트렌드가 강화되는 시간을 판단하여 트렌드 거래를 할 수 있다. 전략의 장점은 신호가 생성되는 위치가 좋고, 트렌드를 따라 잡을 수 있다는 것이다.
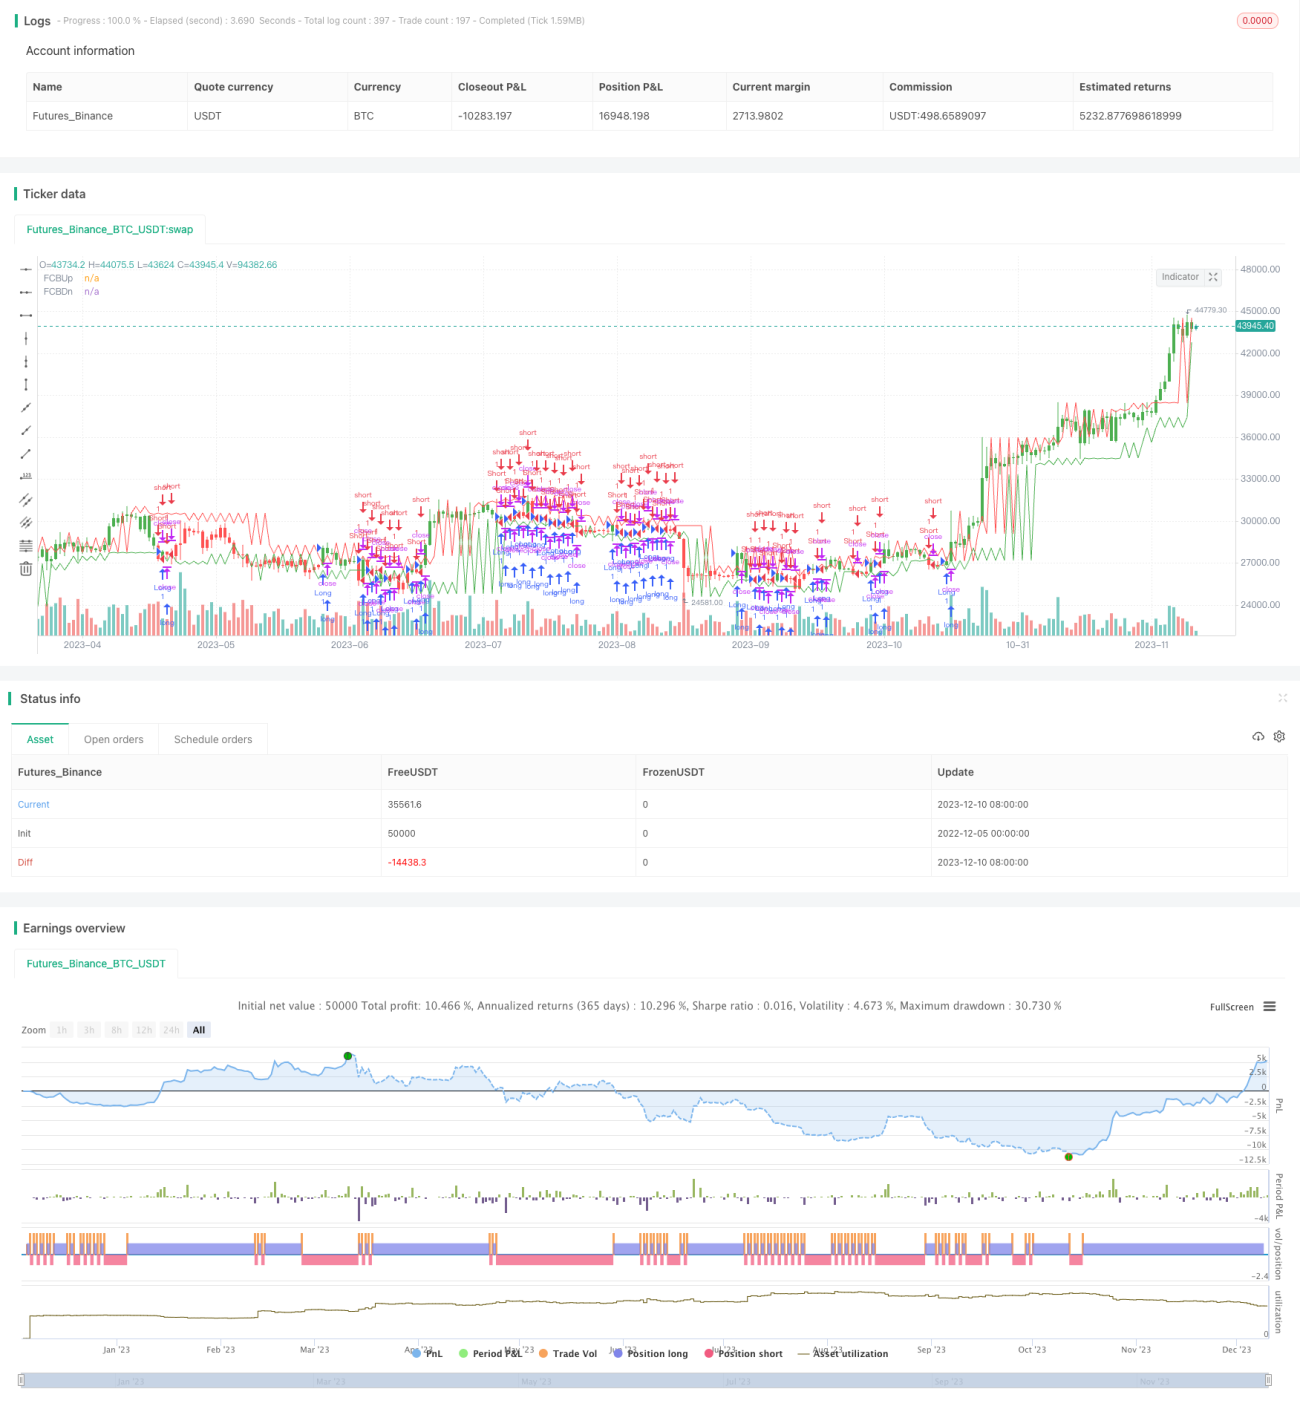
/*backtest
start: 2022-12-05 00:00:00
end: 2023-12-11 00:00:00
period: 1d
basePeriod: 1h
exchanges: [{"eid":"Futures_Binance","currency":"BTC_USDT"}]
*/
//@version=2
////////////////////////////////////////////////////////////
// Copyright by HPotter v1.0 19/02/2018
// Stock market moves in a highly chaotic way, but at a larger scale, the movements
// follow a certain pattern that can be applied to shorter or longer periods of time
// and we can use Fractal Chaos Bands Indicator to identify those patterns. Basically,
// the Fractal Chaos Bands Indicator helps us to identify whether the stock market is
// trending or not. When a market is trending, the bands will have a slope and if market
// is not trending the bands will flatten out. As the slope of the bands decreases, it
// signifies that the market is choppy, insecure and variable. As the graph becomes more
// and more abrupt, be it going up or down, the significance is that the market becomes
// trendy, or stable. Fractal Chaos Bands Indicator is used similarly to other bands-indicator
// (Bollinger bands for instance), offering trading opportunities when price moves above or
// under the fractal lines.
//
// The FCB indicator looks back in time depending on the number of time periods trader selected
// to plot the indicator. The upper fractal line is made by plotting stock price highs and the
// lower fractal line is made by plotting stock price lows. Essentially, the Fractal Chaos Bands
// show an overall panorama of the price movement, as they filter out the insignificant fluctuations
// of the stock price.
//
// You can change long to short in the Input Settings
// WARNING:
// - For purpose educate only
// - This script to change bars colors.
////////////////////////////////////////////////////////////
fractalUp(pattern) =>
p = high[pattern+1]
okl = 1
okr = 1
for i = pattern to 1
okl := iff(high[i] < high[i+1] and okl == 1 , 1, 0)
for i = pattern+2 to pattern*2+1
okr := iff(high[i] < high[i-1] and okr == 1, 1, 0)
res = iff(okl == 1 and okr == 1, p, res[1])
res
fractalDn(pattern) =>
p = low[pattern+1]
okl = 1
okr = 1
for i = pattern to 1
okl := iff(low[i] > low[i+1] and okl == 1 , 1, 0)
for i = pattern+2 to pattern*2+1
okr := iff(low[i] > low[i-1] and okr == 1, 1, 0)
res = iff(okl == 1 and okr == 1, p, res[1])
res
strategy(title="Fractal Chaos Bands", overlay = true)
Pattern = input(1, minval=1)
reverse = input(false, title="Trade reverse")
xUpper = fractalUp(Pattern)
xLower = fractalDn(Pattern)
pos = iff(close > xUpper, 1,
iff(close < xLower, -1, nz(pos[1], 0)))
possig = iff(reverse and pos == 1, -1,
iff(reverse and pos == -1, 1, pos))
if (possig == 1)
strategy.entry("Long", strategy.long)
if (possig == -1)
strategy.entry("Short", strategy.short)
barcolor(possig == -1 ? red: possig == 1 ? green : blue )
plot(xUpper, color=red, title="FCBUp")
plot(xLower, color=green, title="FCBDn")