
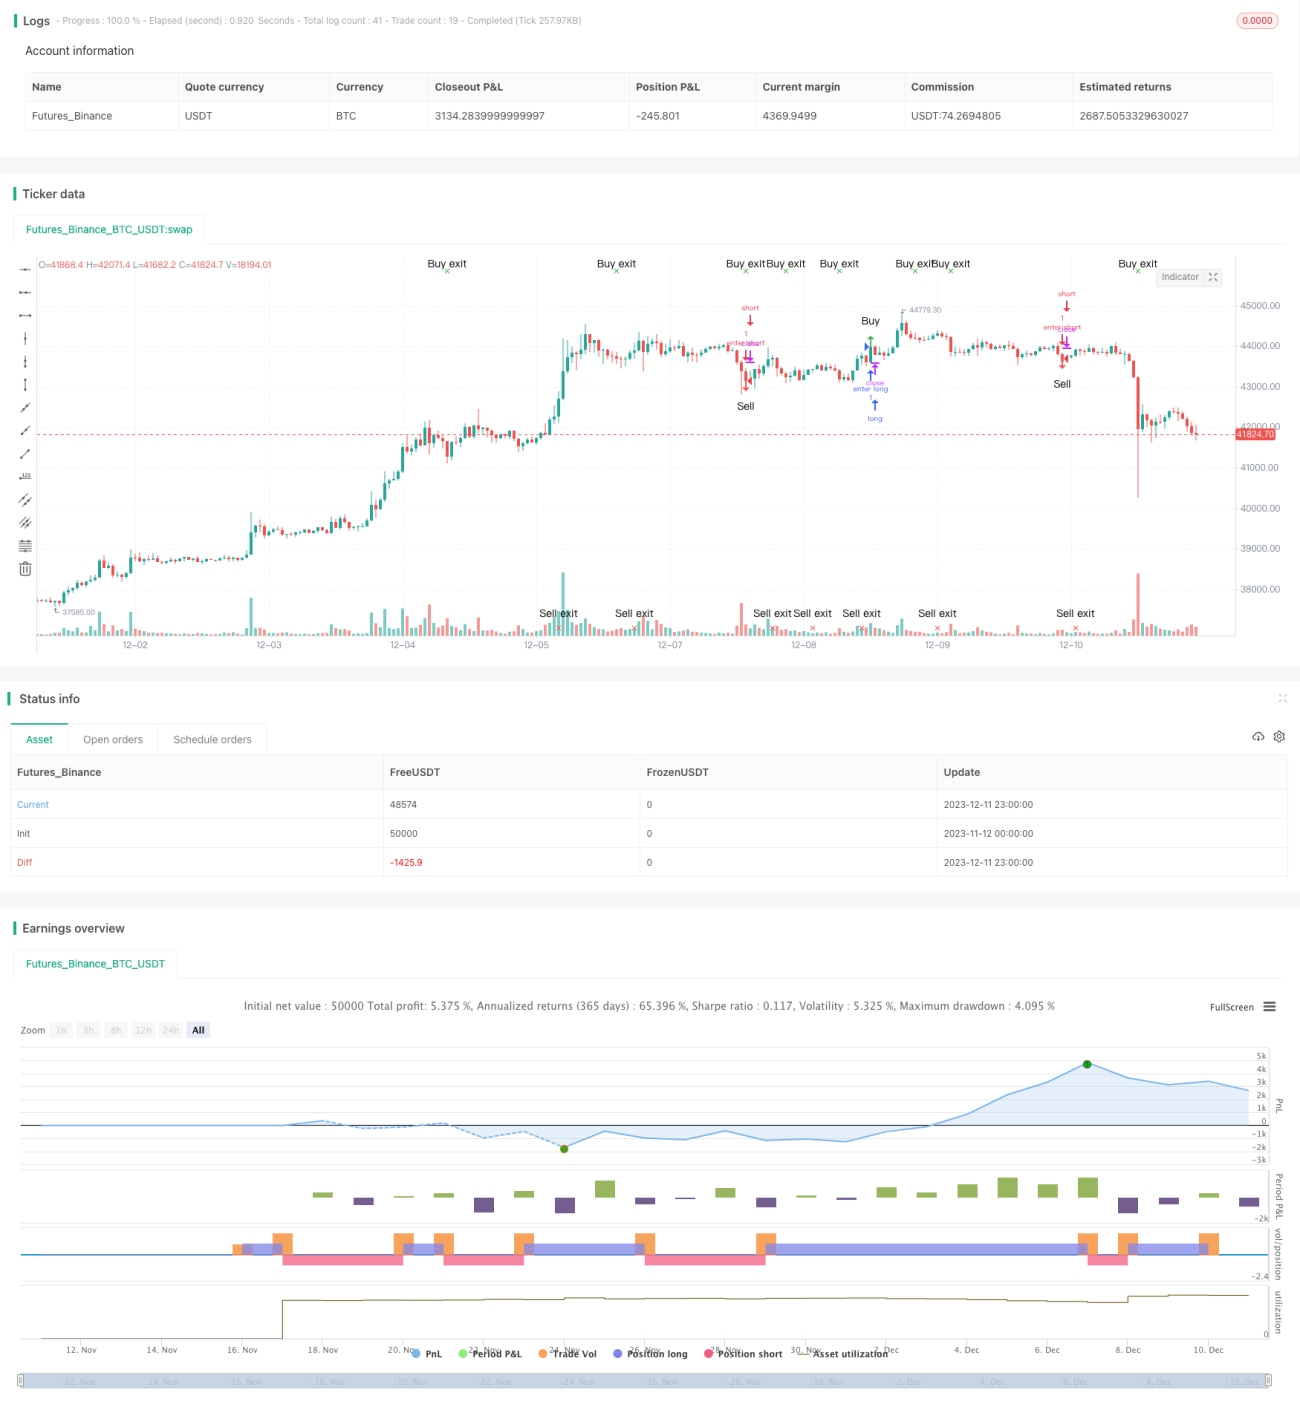
태양광 슈퍼 트렌드 전략은 ATR 및 슈퍼 트렌드 지표에 기반한 트렌드 추적 전략이다. 트렌드 반전을 정확하게 예측할 수 있으며, 시간 순서 지표로 사용하기에 적합하다. 이 전략은 투자자의 인내와 결심을 강화하여 적절한 시간에 시장에 진입하고 퇴출하는 데 도움이 된다.
이 전략은 SuperTrend 지표를 사용하여 현재 트렌드 방향을 판단한다. SuperTrend 지표의 방향이 바뀌면, 우리는 트렌드 반전이 일어날 수 있다고 생각한다. 또한, 전략은 K선 엔티티의 방향을 보조적으로 판단한다. 잠재적인 반전 신호가 나타나 K선 엔티티의 방향이 이전과 일치하면 무효 신호를 필터링한다.
특히, 전략은 다음과 같은 논리에 따라 거래 신호를 생성합니다:
태양광 슈퍼 트렌드 전략은 슈퍼 트렌드 지표에 기반하여 트렌드 반전을 판단하는 고효율 전략이다. K선 엔티티 방향과 결합하여 보조 판단을 수행하여 무효 신호를 효과적으로 필터링하여 신호 품질을 향상시킵니다. 이 전략은 작동이 간단하고 적응력이 강하며 여러 품종과 시간 주기에서 광범위하게 사용할 수 있다. 합리적인 매개 변수 최적화 및 스톱 패스 메커니즘을 추가하면 전략 성능을 더욱 향상시킬 수 있다.
/*backtest
start: 2023-11-12 00:00:00
end: 2023-12-12 00:00:00
period: 1h
basePeriod: 15m
exchanges: [{"eid":"Futures_Binance","currency":"BTC_USDT"}]
*/
//@version=5
strategy("Sunny Supertrend Strategy", overlay=true, default_qty_type=strategy.percent_of_equity)
atrPeriod = input(10, "ATR Length")
factor = input.float(3.0, "Factor", step = 0.01)
[_, direction] = ta.supertrend(factor, atrPeriod)
shor= close > open and close[1] > open[1] and close[2] > open[2]
lon = open > close and open[1] > close[1] and open[2] > close[2]
tt= ta.change(direction) < 0
ss= ta.change(direction) > 0
long= tt
longexit = lon or ss
short= ss
shortexit = shor or tt
longPosMem = false
longexitPosMem = false
shortPosMem = false
shortexitPosMem = false
longPosMem := long ? true : short ? false : longPosMem[1]
longexitPosMem := longexit ? true : shortexit ? false : longexitPosMem[1]
shortPosMem := short ? true : long ? false : shortPosMem[1]
shortexitPosMem := shortexit ? true : longexit ? false : shortexitPosMem[1]
longy = long and not(longPosMem[1])
longexity = longexit and not(longexitPosMem[1])
shorty = short and not(shortPosMem[1])
shortexity = shortexit and not(shortexitPosMem[1])
//Use this to customize the look of the arrows to suit your needs.
plotshape(longy, location=location.abovebar, color=color.green, style=shape.arrowup, text="Buy")
plotshape(longexity, location=location.top, color=color.green, style=shape.xcross, text="Buy exit")
plotshape(shorty, location=location.belowbar, color=color.red, style=shape.arrowdown, text="Sell")
plotshape(shortexity, location=location.bottom, color=color.red, style=shape.xcross, text="Sell exit")
//plot(strategy.equity, title="equity", color=color.red, linewidth=2, style=plot.style_areabr)
// STEP 1:
// Make input options that configure backtest date range
startDate = input.int(title="Start Date", defval=1, minval=1, maxval=31)
startMonth = input.int(title="Start Month",
defval=1, minval=1, maxval=12)
startYear = input.int(title="Start Year",
defval=2021, minval=1800, maxval=2100)
endDate = input.int(title="End Date",
defval=1, minval=1, maxval=31)
endMonth = input.int(title="End Month",
defval=2, minval=1, maxval=12)
endYear = input.int(title="End Year",
defval=2021, minval=1800, maxval=2100)
// STEP 2:
// Look if the close time of the current bar
// falls inside the date range
inDateRange = true
// STEP 3:
// Submit entry orders, but only when bar is inside date range
if (inDateRange and longy)
strategy.entry("enter long",strategy.long,when= longy)
strategy.close("long",when=longexity)
if (inDateRange and shorty)
strategy.entry("enter short",strategy.short,when = shorty)
strategy.close("short", when=shortexity)