변동성 유한용량 요소 전략

저자:차오장, 날짜: 2023-12-19 15:23:59
태그:

img

전반적인 설명

이 전략은 유한량 요소 (FVE) 지표에 기반한 개선이다. FVE는 순수한 볼륨 지표로 가격 변화를 고려하지 않고 자금 유입과 출동에만 초점을 맞추고 있다. 이 전략은 시장 정서와 자금 흐름을 판단하기 위해 FVE를 기반으로 변동성을 기반으로 거래량을 색칠한다.

전략 원칙

전략은 내일 변동성을 계산합니다.Intra그리고 하루 간 변동성Inter, 표준편차와 함께Vintra그리고Vinter, 변동성 임계값을 얻기 위해CutOff그러면 그 차이를 계산합니다.MF자금 유입 (긍정적) 또는 유출 (부적) 을 판단하기 위해 중간 가격, 이전 중간 가격 및 부피MF초과CutOff, 거래량과 변동성이 같은 방향으로 있고 시장에 명백한 열정이 있다는 것을 의미합니다. 색상은 녹색으로 설정됩니다.MF음수 이하입니다.CutOff, 그것은 거래량과 변동성이 같은 방향으로 있고 시장에서 명백한 비관성이 있음을 의미합니다. 색상은 빨간색으로 설정됩니다. 그렇지 않으면 색상은 파란색입니다. 마지막으로 색상을 기반으로 긴 / 짧은 방향을 결정합니다.

이점 분석

이 전략은 거래량 및 변동성 지표를 결합하여 시장 정서를 더 정확하게 판단합니다. 단일 지표와 비교하면 판단에 안정성과 신뢰성의 장점이 있습니다. 또한이 전략의 판단 기준은 변동성에 특별히 설계되어 있으며 다른 시장 조건의 변화에 잘 적응 할 수 있습니다.

위험 분석

이 전략은 거래량 및 변동성 지표에 의존한다. 둘 사이의 오차는 판단에 영향을 미칠 것이다. 또한, 매개 변수 설정은 다른 품종과 매개 변수 조합에서 큰 차이로, 표적 최적화를 요구하는 결과에 더 큰 영향을 미친다.

최적화 방향

거래량 및 변동성으로부터 소음을 피하기 위해 MACD, OBV 등 판단에 도움이되는 다른 지표를 결합하는 것을 고려하십시오. 또한 안정성을 향상시키기 위해 다른 시장 조건에 따라 매개 변수를 동적으로 조정하는 적응 매개 변수 메커니즘을 설계 할 수 있습니다. 또는 특정 품종에 대한 최고의 매개 변수 포트폴리오를 찾기 위해 매개 변수를 백테스트하고 최적화 할 수 있습니다.

요약

이 전략은 시장의 열정을 판단하기 위해 거래량 및 변동성 지표의 장점을 통합합니다. 단일 지표와 비교하면 판단 정확성과 안정성이 높습니다. 그러나 매개 변수 설정 및 다양성 차이로 인해 결과에 상당한 영향을 미치며 다양한 거래 환경에 적응하기 위해 추가 최적화 및 조정이 여전히 필요합니다. 전반적으로 전략은 합리적인 이론적 근거와 개선 잠재력이 있습니다.


/*backtest
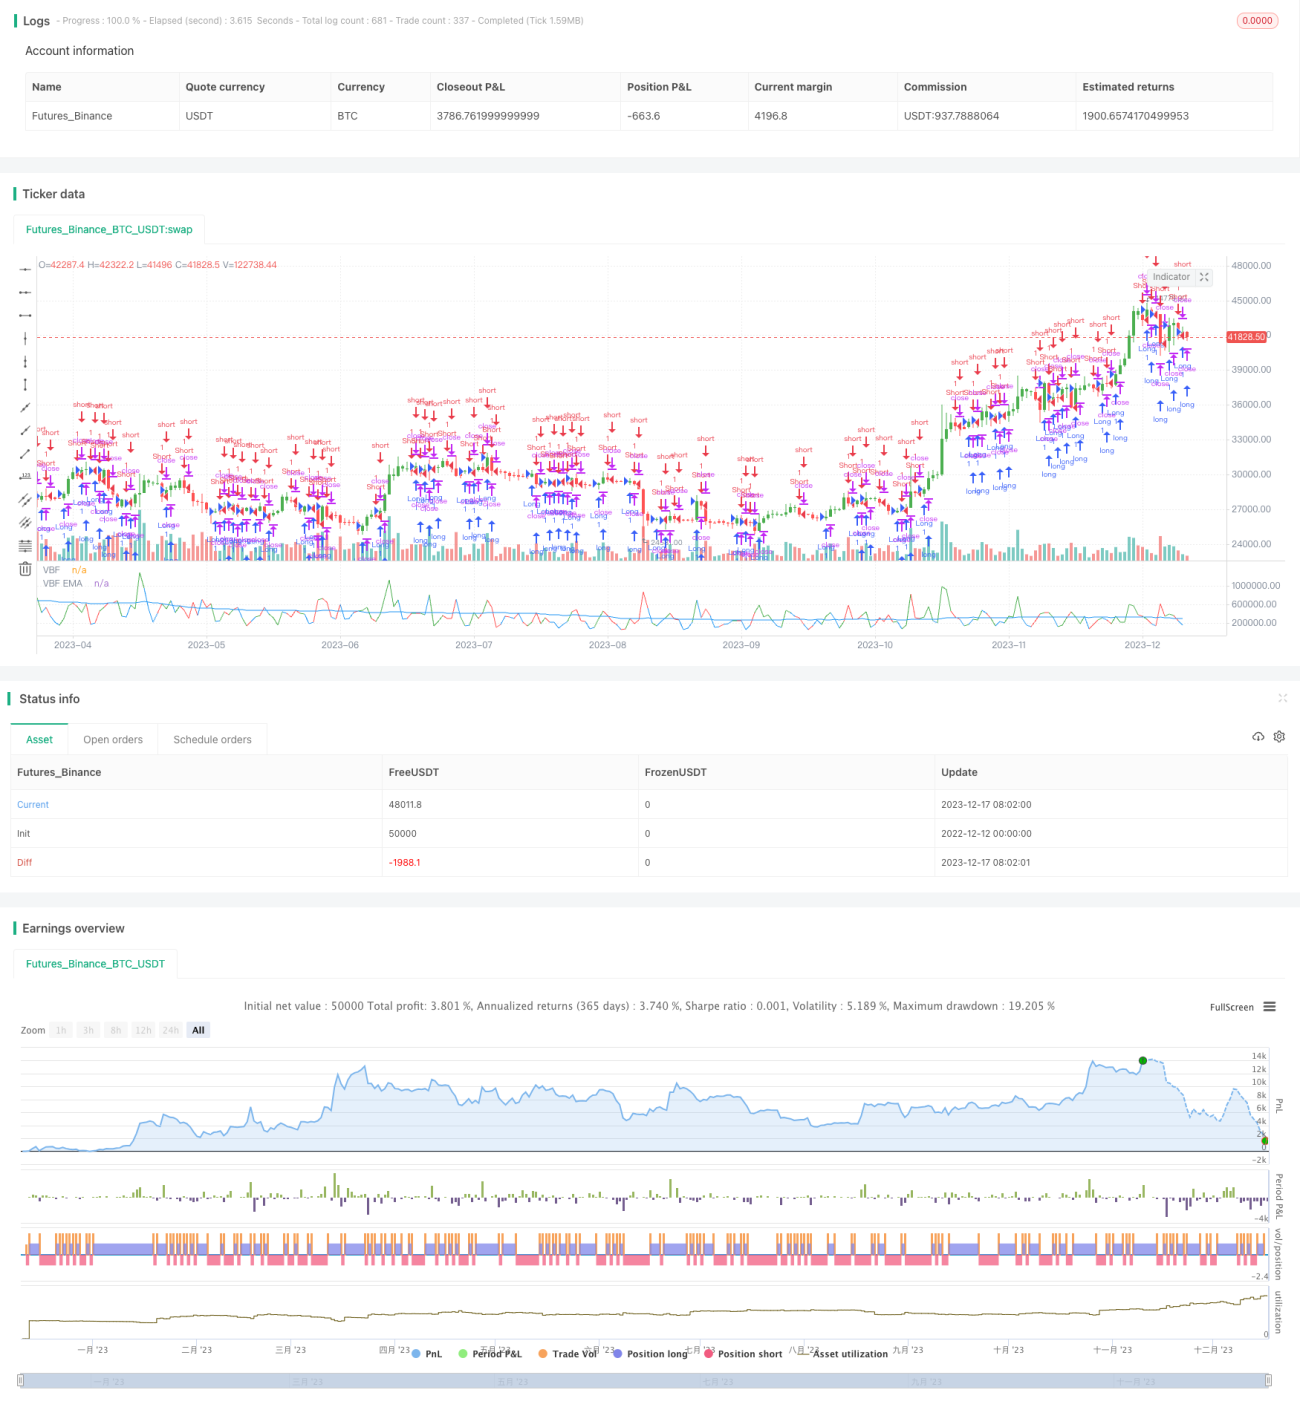
start: 2022-12-12 00:00:00
end: 2023-12-18 00:00:00
period: 1d
basePeriod: 1h
exchanges: [{"eid":"Futures_Binance","currency":"BTC_USDT"}]
*/

//@version=2
////////////////////////////////////////////////////////////
//  Copyright by HPotter v1.0 22/08/2017
// The FVE is a pure volume indicator. Unlike most of the other indicators 
// (except OBV), price change doesn?t come into the equation for the FVE 
// (price is not multiplied by volume), but is only used to determine whether 
// money is flowing in or out of the stock. This is contrary to the current trend 
// in the design of modern money flow indicators. The author decided against a 
// price-volume indicator for the following reasons:
// - A pure volume indicator has more power to contradict.
// - The number of buyers or sellers (which is assessed by volume) will be the same, 
// regardless of the price fluctuation.
// - Price-volume indicators tend to spike excessively at breakouts or breakdowns.
// This study is an addition to FVE indicator. Indicator plots different-coloured volume 
// bars depending on volatility.
//
// You can change long to short in the Input Settings
// Please, use it only for learning or paper trading. Do not for real trading.
////////////////////////////////////////////////////////////
strategy(title="Volatility Finite Volume Elements Strategy", shorttitle="FVI")
Samples = input(22, minval=1)
AvgLength = input(50, minval=1)
AlertPct = input(70, minval=1)
Cintra = input(0.1, step = 0.1)
Cinter = input(0.1, step = 0.1)
reverse = input(false, title="Trade reverse")
xVolume = volume
xClose = close
xhl2 = hl2
xhlc3 = hlc3
xMA = sma(xVolume, AvgLength)
xIntra = log(high) - log(low)
xInter = log(xhlc3) - log(xhlc3[1])
xStDevIntra = stdev(xIntra, Samples)
xStDevInter = stdev(xInter, Samples)
TP = xhlc3
TP1 = xhlc3[1]
Intra = xIntra
Vintra = xStDevIntra
Inter = xInter
Vinter = xStDevInter
CutOff = Cintra * Vintra + Cinter * Vinter
MF = xClose - xhl2 + TP - TP1
clr = iff(MF > CutOff * xClose, green, 
             iff(MF < -1 * CutOff * xClose, red,  blue))
pos = iff(MF > CutOff * xClose, 1,
	   iff(MF < -1 * CutOff * xClose, -1, nz(pos[1], 0))) 
possig = iff(reverse and pos == 1, -1,
          iff(reverse and pos == -1, 1, pos))	   
if (possig == 1) 
    strategy.entry("Long", strategy.long)
if (possig == -1)
    strategy.entry("Short", strategy.short)	   	    
barcolor(possig == -1 ? red: possig == 1 ? green : blue )           
plot(xVolume, color=clr, title="VBF")
plot(xMA, color=blue, title="VBF EMA")

더 많은