개요
이 전략은 변동성 지표인 VIX와 무작위 지표인 RSI를 결합하여, 다른 시간 주기 지표의 조합을 통해, 효율적인 돌파구 구매와 과매매 과매매의 중지 손해 청정을 달성한다. 전략 최적화 공간은 넓고, 다른 시장 환경에 적응할 수 있다.
전략 원칙
VIX 변동률 지표를 계산: 최근 20일간의 최고 가격과 최저 가격의 변동률을 계산한다. 변동률이 상반도를 초과하면 시장 공황을 나타내고, 하반도를 초과하면 시장 만족도를 나타낸다.
RSI를 계산하기: 최근 14일간의 상승과 하락을 계산하여 RSI가 70보다 높을 때 초고 구매 지역이며, 30보다 낮을 때 초판 판매 지역입니다.
두 가지 지표가 합쳐져, 변동률이 상반기 또는 최고 퍼센트보다 높을 때 더 많이; RSI가 70보다 높을 때 평점.
전략적 이점
- 다양한 지표들을 통합하여 시점을 파악하는 방법
- 다양한 시간 주기 지표가 서로 확인되어 의사 결정의 정확성을 높여줍니다.
- 다른 거래 품종에 맞게 최적화 조정 파라미터를 조정할 수 있다.
위험 분석
- 변수 설정이 잘못되면 여러번의 가짜 신호가 발생할 수 있다.
- 단일 평점 지표는 가격 반전을 놓칠 수 있습니다.
최적화 제안
- 더 많은 검증 지표가 추가되었습니다. 예를 들어, 평균자책점, 브린 벨트 등이 진출 시점을 판단합니다.
- K선 모양을 반전하는 것과 같은 평형 지표를 더 추가하십시오.
요약하다
이 전략은 시장의 시점과 위험 수준을 VIX 지표로 판단하고 RSI 지표와 함께 과매매 과매매의 불리한 거래 지점을 필터링하여 효율적인 시간에 구매하고 적시에 손실을 중지합니다. 전략 최적화 공간은 더 넓은 시장 환경에 적합합니다.
전략 소스 코드
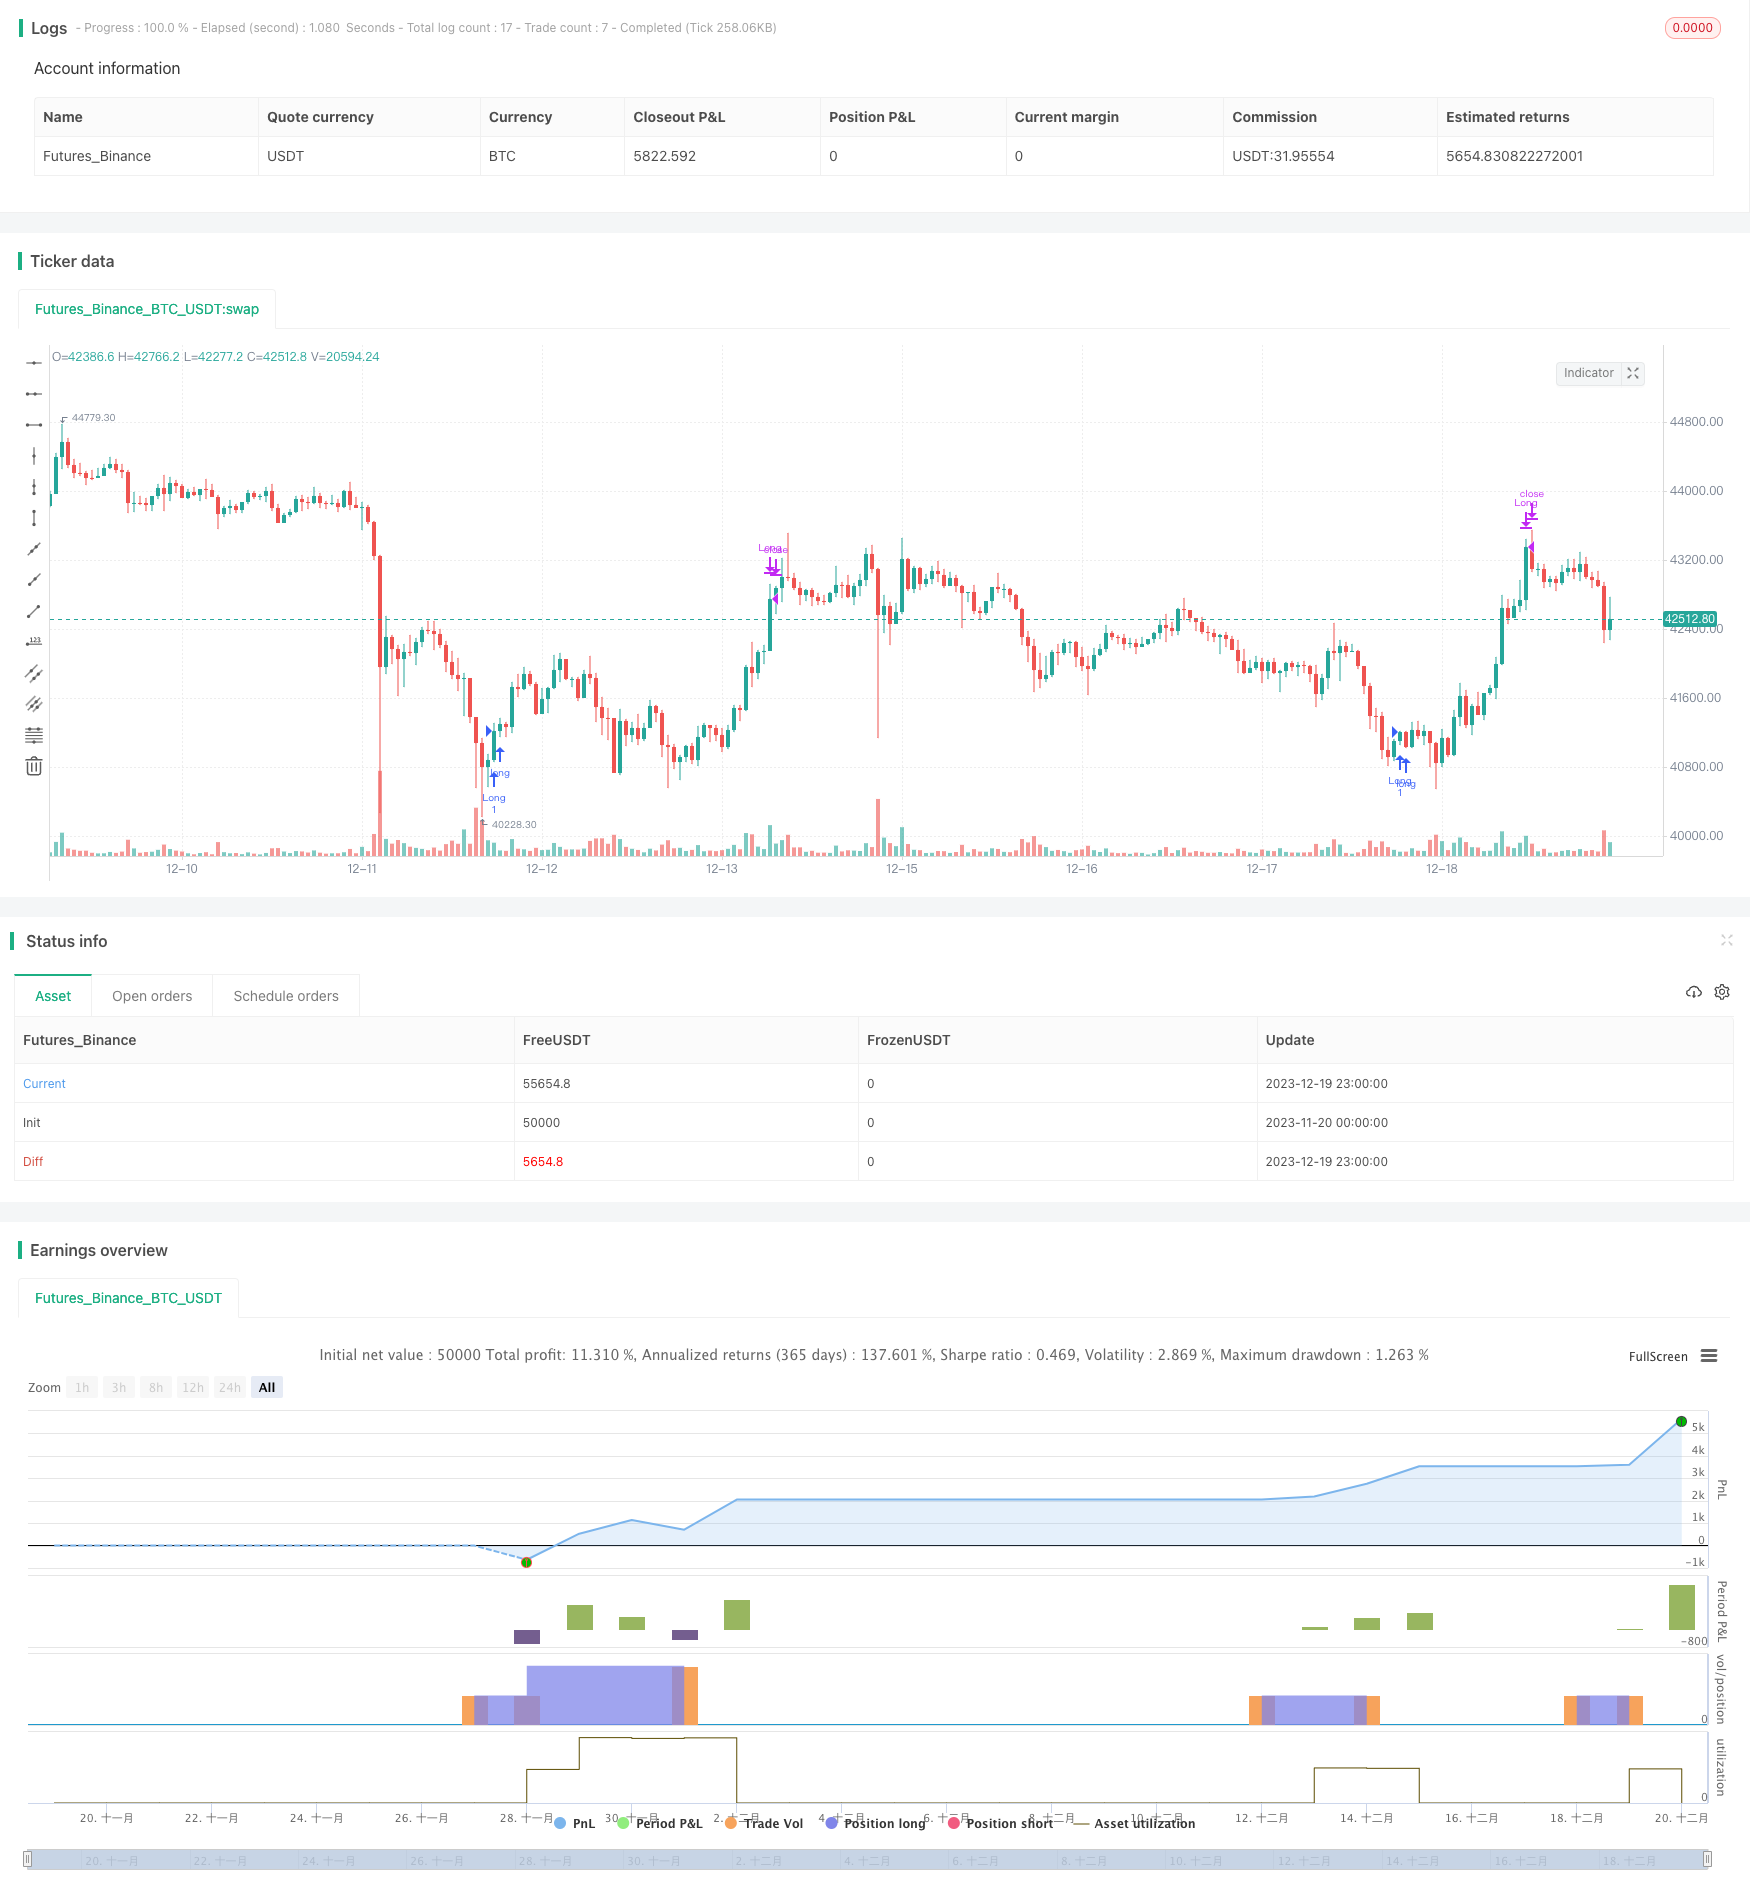
/*backtest
start: 2023-11-20 00:00:00
end: 2023-12-20 00:00:00
period: 1h
basePeriod: 15m
exchanges: [{"eid":"Futures_Binance","currency":"BTC_USDT"}]
*/

//@version=5
// This source code is subject to the terms of the Mozilla Public License 2.0 at https://mozilla.org/MPL/2.0/
// © timj

strategy('Vix FIX / StochRSI Strategy', overlay=true, pyramiding=9, margin_long=100, margin_short=100)

Stochlength = input.int(14, minval=1, title="lookback length of Stochastic")
StochOverBought = input.int(80, title="Stochastic overbought condition")
StochOverSold = input.int(20, title="Stochastic oversold condition")
smoothK = input(3, title="smoothing of Stochastic %K ")
smoothD = input(3, title="moving average of Stochastic %K")
k = ta.sma(ta.stoch(close, high, low, Stochlength), smoothK)
d = ta.sma(k, smoothD)

///////////// RSI
RSIlength = input.int( 14, minval=1 , title="lookback length of RSI")
RSIOverBought = input.int( 70  , title="RSI overbought condition")
RSIOverSold = input.int( 30  , title="RSI oversold condition")
RSIprice = close
vrsi = ta.rsi(RSIprice, RSIlength)

///////////// Double strategy: RSI strategy + Stochastic strategy

pd = input(22, title="LookBack Period Standard Deviation High")
bbl = input(20, title="Bolinger Band Length")
mult = input.float(2.0    , minval=1, maxval=5, title="Bollinger Band Standard Devaition Up")
lb = input(50  , title="Look Back Period Percentile High")
ph = input(.85, title="Highest Percentile - 0.90=90%, 0.95=95%, 0.99=99%")
new = input(false, title="-------Text Plots Below Use Original Criteria-------" )
sbc = input(false, title="Show Text Plot if WVF WAS True and IS Now False")
sbcc = input(false, title="Show Text Plot if WVF IS True")
new2 = input(false, title="-------Text Plots Below Use FILTERED Criteria-------" )
sbcFilt = input(true, title="Show Text Plot For Filtered Entry")
sbcAggr = input(true, title="Show Text Plot For AGGRESSIVE Filtered Entry")
ltLB = input.float(40, minval=25, maxval=99, title="Long-Term Look Back Current Bar Has To Close Below This Value OR Medium Term--Default=40")
mtLB = input.float(14, minval=10, maxval=20, title="Medium-Term Look Back Current Bar Has To Close Below This Value OR Long Term--Default=14")
str = input.int(3, minval=1, maxval=9, title="Entry Price Action Strength--Close > X Bars Back---Default=3")
//Alerts Instructions and Options Below...Inputs Tab
new4 = input(false, title="-------------------------Turn On/Off ALERTS Below---------------------" )
new5 = input(false, title="----To Activate Alerts You HAVE To Check The Boxes Below For Any Alert Criteria You Want----")
sa1 = input(false, title="Show Alert WVF = True?")
sa2 = input(false, title="Show Alert WVF Was True Now False?")
sa3 = input(false, title="Show Alert WVF Filtered?")
sa4 = input(false, title="Show Alert WVF AGGRESSIVE Filter?")

//Williams Vix Fix Formula
wvf = ((ta.highest(close, pd)-low)/(ta.highest(close, pd)))*100
sDev = mult * ta.stdev(wvf, bbl)
midLine = ta.sma(wvf, bbl)
lowerBand = midLine - sDev
upperBand = midLine + sDev
rangeHigh = (ta.highest(wvf, lb)) * ph

//Filtered Bar Criteria
upRange = low > low[1] and close > high[1]
upRange_Aggr = close > close[1] and close > open[1]
//Filtered Criteria
filtered = ((wvf[1] >= upperBand[1] or wvf[1] >= rangeHigh[1]) and (wvf < upperBand and wvf < rangeHigh))
filtered_Aggr = (wvf[1] >= upperBand[1] or wvf[1] >= rangeHigh[1]) and not (wvf < upperBand and wvf < rangeHigh)

//Alerts Criteria
alert1 = wvf >= upperBand or wvf >= rangeHigh ? 1 : 0
alert2 = (wvf[1] >= upperBand[1] or wvf[1] >= rangeHigh[1]) and (wvf < upperBand and wvf < rangeHigh) ? 1 : 0
alert3 = upRange and close > close[str] and (close < close[ltLB] or close < close[mtLB]) and filtered ? 1 : 0
alert4 = upRange_Aggr and close > close[str] and (close < close[ltLB] or close < close[mtLB]) and filtered_Aggr ? 1 : 0

//Coloring Criteria of Williams Vix Fix
col = wvf >= upperBand or wvf >= rangeHigh ? color.lime : color.gray

isOverBought = (ta.crossover(k,d) and k > StochOverBought) ? 1 : 0
isOverBoughtv2 = k > StochOverBought ? 1 : 0
filteredAlert = alert3 ? 1 : 0
aggressiveAlert = alert4 ? 1 : 0


if (filteredAlert or aggressiveAlert)
    strategy.entry("Long", strategy.long)

if (isOverBought)
    strategy.close("Long")