전략 개요
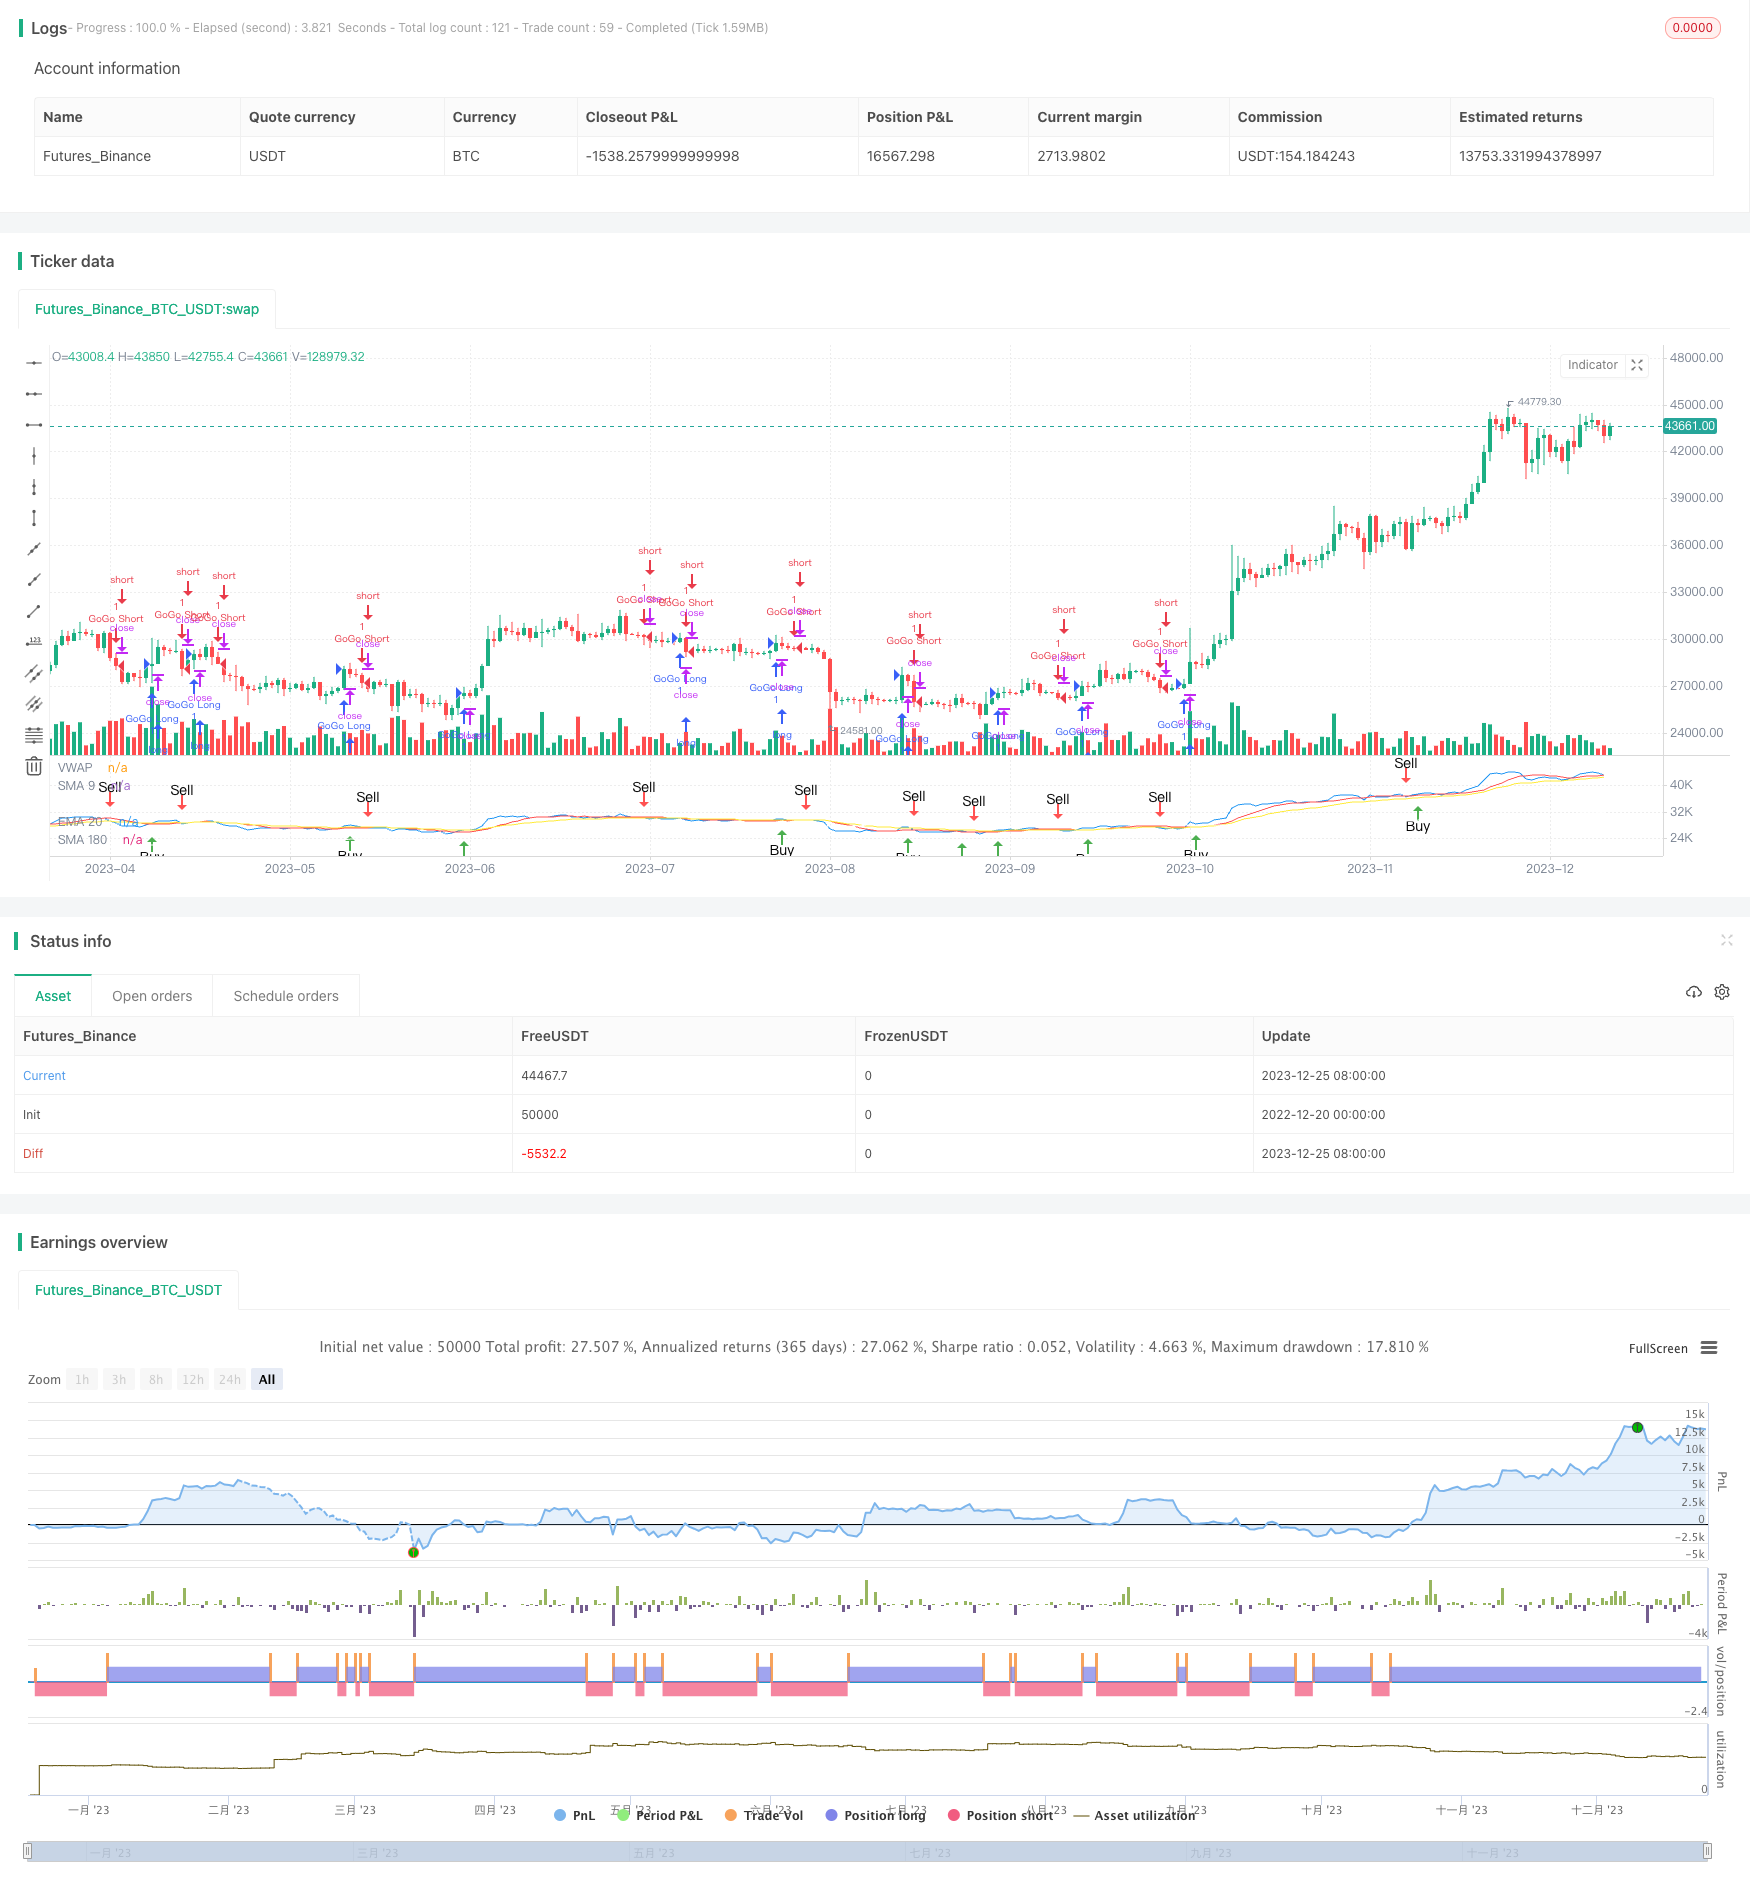
JBravo의 양적 트렌드 전략은 이동 평균에 기반한 트렌드 추적 전략이다. 그것은 9일 간소 이동 평균, 20일 지수 이동 평균, 180일 간소 이동 평균을 사용하여 시장의 트렌드 방향을 판단하고, 최종 구매 및 판매 신호를 낸다.
이 전략의 이름은 조니 브라보 (Johnny Bravo) 라는 애니메이션 캐릭터에서 영감을 받아 자신감 있고 결정적인 거래 결정을 나타냅니다. GoGo 은 VWAP 라인이 20일 지수 이동 평균을 통과했을 때 열렬한 진입을 묘사합니다.
전략 원칙
한 K선 종결 가격 위에 9일 간단한 이동 평균을 통과했을 때, 구매 신호를 생성한다. 종결 가격 아래 20일 지수 이동 평균을 통과했을 때, 판매 신호를 생성한다.
9일, 20일, 180일 이동 평균이 모두 상승하고, 9일 이동 평균이 20일 이동 평균보다 높으면, 20일 이동 평균이 180일 이동 평균보다 높으면, 강력한 구매 신호가 발생한다.
9일, 20일, 180일 이동 평균이 모두 하향을 향하고, 9일 이동 평균이 20일 이동 평균보다 낮으면, 20일 이동 평균이 180일 이동 평균보다 낮으면, 강력한 매매 신호가 발생한다.
거래량 가중 평균 가격선이 20일 지수 이동 평균을 위쪽에서 넘어가면 GoGo 보 신호가 발생한다. 거래량 가중 평균 가격선이 20일 지수 이동 평균을 위쪽에서 넘어가면 GoGo 보 신호가 발생한다.
전략적 강점 분석
이 전략은 트렌드 추적과 브레이크의 전략적 사고를 결합한다. 이동 평균은 시장의 트렌드 방향을 명확하게 판단하여 잘못된 거래의 가능성을 줄인다. 동시에, 거래량 가중 평균 가격이라는 지표를 적용하여 시장 진입 시기를 판단하며 위험을 통제합니다.
이 전략은 이동 평균을 사용하는 것에 비해 GoGo 의 급성 진출 메커니즘을 추가하여 강세를 보인다면 더 높은 시장 수익률을 얻을 수 있다.
전체적으로 이 전략은 소규모의 회수와 안정적인 수익성을 가지고 있다.
전략적 위험 분석
이 전략은 강력한 입문 메커니즘을 추가했지만, 충격적인 상황에서는 스톱로스가 자주 유발될 수 있다. 또한, 이동 평균은 자체적으로 지연성이 강하여 가격 변화를 적시에 포착할 수 없다.
이것은 전략이 실제 시장 가격을 반영하지 못하는 가상 거래를 일정한 수량으로 생성 할 수 있음을 의미합니다. 또한, 강력한 입장은 손실의 위험을 증가시킵니다.
위험을 줄이기 위해 이동 평균의 주기를 적절하게 조정할 수 있습니다. 또는 손실이 일정 정도에 도달 한 후 손실을 중단하여 탈퇴하는 손실 모듈을 추가 할 수 있습니다.
전략 최적화 방향
이 전략은 다음과 같은 방향으로 최적화될 수 있습니다.
이동 평균 변수를 조정하고, 주기 변수를 최적화하여 최적의 변수 조합을 찾습니다.
거래량 지표 판단을 높여 가격의 급격한 변동에서 잘못된 신호를 피하십시오.
스톱 손실 모듈을 추가하고, 오프 경기 규칙을 설정하고, 단독 손실을 제어합니다.
시장의 뜨거운 부문 선택과 결합하여 전략이 더 타겟팅됩니다.
포지션 비율을 최적화하고, 다른 매개 변수를 다른 포지션 스케일로 최적화
요약하다
JBravo의 양적 트렌드 전략은 이동 평균 분석과 거래량 가중 평균 가격의 트렌드 판단을 통합한다. 그것은 안정적인 긴 라인 수익을 추구하지만, 약간의 적극적인 거래 메커니즘을 가지고 있다. 이 전략은 중간 긴 라인 보유, 위험 중간 등에 적합하며, 수익률이 높다. 그것은 포트폴리오 거래 전략의 구성 요소가 될 수 있으며, 시장 적응성이 좋다.
||
Strategy Overview
The JBravo Quantitative Trend Strategy is a trend-following strategy based on moving averages. It uses the 9-day simple moving average, 20-day exponential moving average, and 180-day simple moving average to determine the market trend direction, as well as the final buy and sell signals.
The strategy name is inspired by the cartoon character Johnny Bravo, representing a confident and decisive trading decision. The term “GoGo Juice” depicts the aggressive entry when the VWAP line crosses the 20-day exponential moving average.
Strategy Principle
A buy signal is generated when the closing price crosses above the 9-day simple moving average; A sell signal is generated when the closing price crosses below the 20-day exponential moving average.
If the 9-day, 20-day and 180-day moving averages are all moving up, and the 9-day moving average is above the 20-day moving average, the 20-day moving average is above the 180-day moving average, a strong buy signal is generated.
If the 9-day, 20-day and 180-day moving averages are all moving down, and the 9-day moving average is below the 20-day moving average, the 20-day moving average is below the 180-day moving average, a strong sell signal is generated.
When the Volume Weighted Average Price line crosses the 20-day exponential moving average upward, a “GoGo Long” signal is generated; When the Volume Weighted Average Price line crosses the 20-day exponential moving average downward, a “GoGo Short” signal is generated.
Advantage Analysis
This strategy combines the ideas of trend following and breakout strategies. Moving averages can clearly determine the direction of the market trend and reduce the probability of wrong trades. At the same time, it flexibly uses the VWAP indicator to determine the entry time, controlling risks while favoring breakthroughs in the market.
Compared to using moving averages alone, this strategy adds the aggressive entry mechanism of “GoGo Juice”, which can obtain higher returns in strong trends.
Overall, this strategy has small drawdowns and stable profitability.
Risk Analysis
Although the strategy increases the strength of entries, stop loss points can be frequently triggered in sideways markets. In addition, moving averages themselves have high inertia and cannot keep up with price changes in time.
This means that the strategy may generate a certain number of virtual trades that do not actually reflect market price movements. In addition, aggressive entries also increase the risk of losses.
To reduce risks, we can adjust the cycle of moving averages as appropriate; or add a stop loss module to stop loss when losses reach a certain level.
Optimization Directions
The strategy can be optimized in the following directions:
Adjust moving average parameters and optimize cycle parameters to find the optimal parameter combination
Add volume indicators to avoid false signals in times of violent price fluctuations
Increase stop loss modules and set exit rules to control per trade loss
Combine selections of market hot sectors to make strategies more targeted
Optimize opening position proportions, optimize different scale for different parameters
Conclusion
The JBravo Quantitative Trend Strategy integrates moving average analysis and VWAP trend judgment. It pursues stable long-term profits while having a certain degree of aggressive trading mechanisms. The strategy is suitable for medium-long term holdings, with medium-high risks and high returns. It can become a part of portfolio trading strategies with very good market adaptability.
[/trans]
/*backtest
start: 2022-12-20 00:00:00
end: 2023-12-26 00:00:00
period: 1d
basePeriod: 1h
exchanges: [{"eid":"Futures_Binance","currency":"BTC_USDT"}]
*/

// This source code is subject to the terms of the Mozilla Public License 2.0 at https://mozilla.org/MPL/2.0/
// © bradvaughn

//@version=4
strategy("JBravo Swing", overlay = false)

var buy_in_progress = false


//Moving Averages
smaInput1 = input(title="Display SMA 9", type=input.bool, defval=true)
smaInput2 = input(title="Display EMA 20", type=input.bool, defval=true)
smaInput4 = input(title="Display SMA 180", type=input.bool, defval=true)
colored_180 = input(false, title="Color-code 180 trend direction")
vwapInput = input(title="Display VWAP", type=input.bool, defval=true)

sma9 = sma(close, 9)
ema20 = ema(close, 20)
sma180 = sma(close, 180)

//Plot Moving Averages
plot(smaInput1 ? sma9 : na, color= color.red, title="SMA 9")
plot(smaInput2 ? ema20 : na, color = color.yellow, title="EMA 20")

// Plot VWAP
vwap1 = vwap(hlc3)
plot(vwapInput ? vwap1 : na, color = color.blue, title="VWAP")
vwaplong = vwap1 > ema20
vwapshort = vwap1 < ema20

//Color SMA 180 trend direction if selected
sma180_uptrend = sma(close, 180) > sma(close[2], 180)
colr = sma180_uptrend == true or colored_180 == false ? color.white : colored_180 == true ? color.gray : na
plot(smaInput4 ? sma180 : na, color = colr, title="SMA 180")

//Get value of lower end of candle
buyLow = iff(lowest(open, 1) < lowest(close, 1), lowest(open, 1), lowest(close, 1))
sellLow = lowest(close, 1)

// Find the lower MA for crossover sell condition
sellma = iff((sma9<ema20), sma9, ema20)


//SMA 9 trend direction
sma9_uptrend = sma(close, 9) > sma(close[2], 9)
//EMA 20 trend direction
ema20_uptrend = ema(close, 20) > sma(close[2], 20)

//Buy or sell if conditions are met
// Buy when the candle low is above the SMA9
// Sell when the candle low is below the lower of SMA9 and EMA20
Buy = iff(buy_in_progress == false and buyLow > sma9 == true, true, false)
Sell = iff(buy_in_progress == true and sellLow < sellma == true, true, false)

// Determine stong buy and strong sell conditions.
// If moving averages are all up, then this will qualify a buy as a strong buy.
// If the moving averages are not up (ie. down) then this will qualify a sell as a strong sell
StrongBuy = iff (Buy and sma9_uptrend and sma180_uptrend and ema20_uptrend and (sma9 > ema20) and (ema20 > sma180), true, false)
StrongSell = iff (Sell and not sma9_uptrend and not sma180_uptrend and not ema20_uptrend and (sma9 < ema20) and (ema20 < sma180), true, false)

//Update Trading status if bought or sold
if Buy
    buy_in_progress := true
if Sell
    buy_in_progress := false

// Clear Buy and Sell conditions if StrongBuy or StrongSell conditions exist.
// This disables plotting Buy and Sell conditions
if StrongBuy
    Buy := false
if StrongSell
    Sell := false


//Display BUY/SELL indicators

plotshape(Buy,title="Buy", color=color.green, style=shape.arrowup,location=location.belowbar, text="Buy")
plotshape(StrongBuy,title="Strong Buy", color=color.green, style=shape.arrowup,location=location.belowbar, text="Strong Buy")
plotshape(Sell,title="Sell", color=color.red, style=shape.arrowdown,text="Sell")
plotshape(StrongSell,title="Strong Sell", color=color.red, style=shape.arrowdown,text="Strong Sell")

strategy.entry("GoGo Long", strategy.long, 1, when=vwaplong and vwapInput)
strategy.entry("GoGo Short", strategy.short, 1, when=vwapshort and vwapInput)

strategy.close("GoGo Long", when = vwapshort and vwapInput)
strategy.close("GoGo Short", when = vwaplong and vwapInput)


alertcondition(Buy, title="Buy Signal", message="Buy")
alertcondition(Sell, title="Sell Signal", message="Sell")