개요
이 전략은 평평한 흔들림 지표를 기반으로 가격 추세를 식별하고 트렌드 추적 방식을 사용하여 거래합니다. 가격이 지표선을 돌파 할 때 상향을, 가격이 지표선을 넘어갈 때 하향을 니다.
전략 원칙
이 전략은 가격 트렌드를 식별하기 위해 사용자 정의 된 평평한 흔들림 지표를 사용합니다. 지표는 현재 K 선의 역회계 가격, 즉 손실과 궤적 도표 색상을 반전시킬 수있는 이론적 가격을 계산합니다. 그 후 이 역회계 가격에 대한 평평한 처리를 통해 최종 평평한 흔들림 지표선을 얻습니다. 가격이 지표선보다 높을 때 (아래) 인 경우 상승 (아래) 추세에 있음을 나타냅니다.
전략은 지표선을 뚫는 것을 지주 신호로 사용한다. 가격이 지표선을 뚫을 때 더 많이 하고, 가격이 지표선을 넘어갈 때 공백을 한다. 스톱로스 라인은 출입 가격의 일정한 비율로 설정되어 수익을 잠금하고 위험을 통제한다.
전략적 이점
- 사용자 정의 지표를 사용하여 트렌드를 확인하고, 더 나은 결과를 측정합니다.
- 트렌드 추적을 사용하며, 대략 양적 트렌드 거래 이론과 일치합니다.
- 스톱 손실 설정은 위험 통제에 도움이 됩니다.
위험 분석
- 지표가 다소 퇴행하여 전략이 좋지 않을 수 있습니다.
- 단 하나의 지표만으로도 잘못된 신호를 내보낼 수 있습니다.
- 정지 손해 설정에 최적화 할 여지가 있으며, 초정지 현상이 발생할 수 있습니다.
최적화 방향
- 다른 지표와 결합하여 거래 신호를 필터링하는 것을 고려하십시오.
- 다른 지표 변수 설정을 테스트
- 손해 방지 방법을 테스트하고 최적화합니다.
- 다양한 종과 주기별로 더 많은 데이터를 테스트합니다.
요약하다
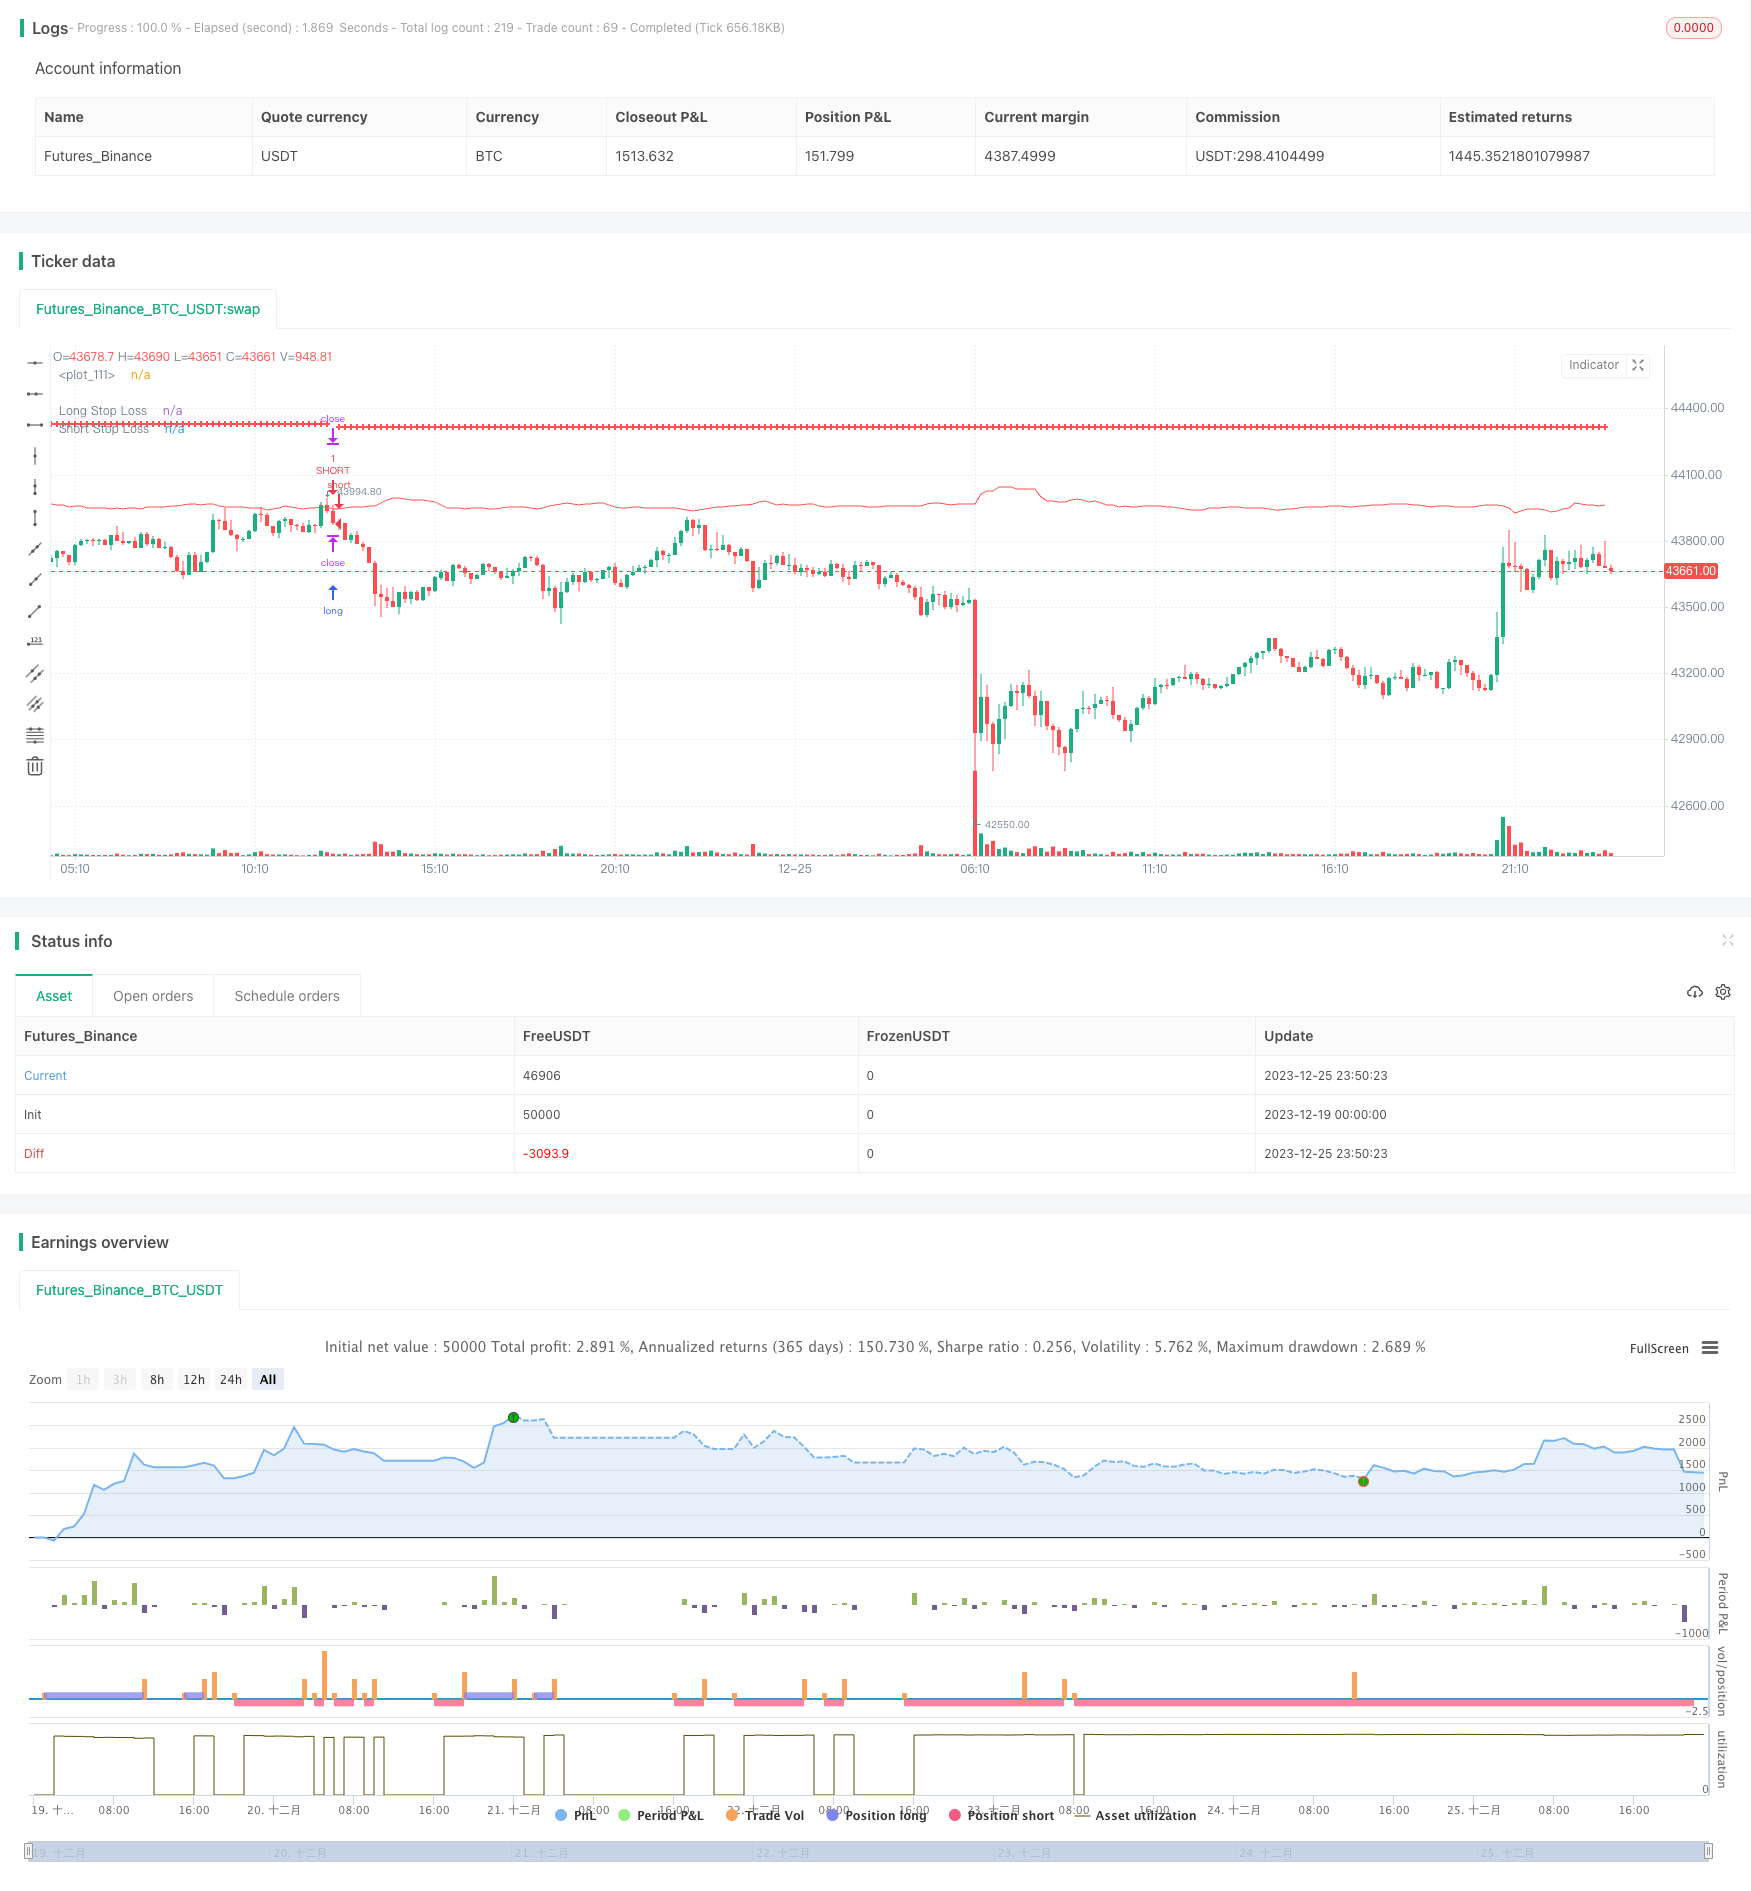
이 전략은 전체적인 아이디어가 명확하며, 사용자 정의 지표가 트렌드를 식별하고 트렌드 추적 방식으로 거래한다. 재검토 결과에서 볼 때, 전략은 좋은 성능을 보이고, 실장 사용 잠재력이 있다. 그러나 단 하나의 지표에만 의존하고 약간의 회귀가 있으며, 신호 품질은 아직 검증되지 않았다. 또한, 손해 방지 메커니즘은 추가 테스트 및 최적화가 필요합니다.
전략 소스 코드
/*backtest
start: 2023-12-19 00:00:00
end: 2023-12-26 00:00:00
period: 10m
basePeriod: 1m
exchanges: [{"eid":"Futures_Binance","currency":"BTC_USDT"}]
*/

// This source code is subject to the terms of the Mozilla Public License 2.0 at https://mozilla.org/MPL/2.0/

// © TraderHalai
// This is a backtest of the Smoothed Heikin Ashi Trend indicator, which computes the reverse candle close price required to flip a heikin ashi trend from red to green and vice versa. Original indicator can be found on the scripts section of my profile.

// Default testing parameters are 10% of equity position size, with a 1% stop loss on short and long strategy.opentrades.commission

// This particular back test uses this indicator as a Trend trading tool with a tight stop loss. The equity curve as tested seems promising but requires further work to refine. Note in an actual trading setup, you may wish to use this with volatilty filters as most of the losses are in sideways, low volatility markets.


//@version=5
strategy("Smoothed Heikin Ashi Trend on Chart - TraderHalai BACKTEST", " SHA Trend - BACKTEST", overlay=true)
//Inputs

i_useSmooth =       input ( true, "Use smoothing Heikin Ashi")
i_smoothingMethod = input.string("SMA", "Method", options=["SMA", "EMA", "HMA", "VWMA", "RMA"])
i_smoothingPeriod = input ( 10, "Smoothing period")

i_infoBox   =       input ( true, "Show Info Box"        )
i_decimalP  =       input ( 2,    "Prices Decimal Places")
i_boxOffSet =       input ( 5,    "Info Box Offset"      )
i_repaint   =       input (false,  "Repaint -  Keep on for live / Off for backtest")

i_longLossPerc = input.float(title="Long Stop Loss (%)",minval=0.0, step=0.1, defval=1) * 0.01

i_shortLossPerc = input.float(title="Short Stop Loss (%)", minval=0.0, step=0.1, defval=1) * 0.01


timeperiod = timeframe.period

//Security functions to avoid repaint, as per PineCoders
f_secureSecurity(_symbol, _res, _src) => request.security(_symbol, _res, _src[1], lookahead = barmerge.lookahead_on)
f_security(_symbol, _res, _src, _repaint) => request.security(_symbol, _res, _src[_repaint ? 0 : barstate.isrealtime ? 1 : 0])[_repaint ? 0 : barstate.isrealtime ? 0 : 1]
f_secSecurity2(_symbol, _res, _src) => request.security(_symbol, _res, _src[1])


candleClose = f_security(syminfo.tickerid, timeperiod, close, i_repaint)
candleOpen = f_security(syminfo.tickerid, timeperiod, open, i_repaint)
candleLow = f_security(syminfo.tickerid, timeperiod, low, i_repaint)
candleHigh = f_security(syminfo.tickerid, timeperiod, high, i_repaint)

haTicker = ticker.heikinashi(syminfo.tickerid)
haClose = f_security(haTicker, timeperiod, close, i_repaint)
haOpen = f_security(haTicker, timeperiod, open, i_repaint)
haLow = f_security(haTicker, timeperiod, low, i_repaint)
haHigh= f_security(haTicker, timeperiod, high, i_repaint)


reverseClose = (2 * (haOpen[1] + haClose[1])) - candleHigh - candleLow - candleOpen

if(reverseClose < candleLow)
    reverseClose := (candleLow + reverseClose) / 2

if(reverseClose > candleHigh)
    reverseClose := (candleHigh + reverseClose) / 2

//Smoothing

smaSmoothed = ta.sma(reverseClose, i_smoothingPeriod)
emaSmoothed = ta.ema(reverseClose, i_smoothingPeriod)
hmaSmoothed = ta.hma(reverseClose, i_smoothingPeriod)
vwmaSmoothed = ta.vwma(reverseClose, i_smoothingPeriod)
rmaSmoothed = ta.rma(reverseClose, i_smoothingPeriod)

shouldApplySmoothing = i_useSmooth and i_smoothingPeriod > 1

smoothedReverseClose = reverseClose

if(shouldApplySmoothing)
    if(i_smoothingMethod == "SMA")
        smoothedReverseClose := smaSmoothed
    else if(i_smoothingMethod == "EMA")
        smoothedReverseClose := emaSmoothed
    else if(i_smoothingMethod == "HMA")
        smoothedReverseClose := hmaSmoothed
    else if(i_smoothingMethod == "VWMA")
        smoothedReverseClose := vwmaSmoothed
    else if(i_smoothingMethod == "RMA")
        smoothedReverseClose := rmaSmoothed
    else
        smoothedReverseClose := reverseClose // Default to non-smoothed for invalid smoothing type

haBull = candleClose >= smoothedReverseClose
haCol = haBull ? color.green : color.red


//Overall trading strategy
if(ta.crossover(candleClose, smoothedReverseClose))
    strategy.entry("LONG", strategy.long, stop=smoothedReverseClose)
else
    strategy.cancel("LONG")

if(ta.crossunder(candleClose, smoothedReverseClose))
    strategy.entry("SHORT", strategy.short, stop=smoothedReverseClose)
else
    strategy.cancel("SHORT")


longStopPrice  = strategy.position_avg_price * (1 - i_longLossPerc)
shortStopPrice = strategy.position_avg_price * (1 + i_shortLossPerc)


plot(series=(strategy.position_size > 0) ? longStopPrice : na,
     color=color.red, style=plot.style_cross,
     linewidth=2, title="Long Stop Loss")
plot(series=(strategy.position_size < 0) ? shortStopPrice : na,
     color=color.red, style=plot.style_cross,
     linewidth=2, title="Short Stop Loss")

plot(smoothedReverseClose, color=haCol)

if (strategy.position_size > 0)
    strategy.exit(id="XL STP", stop=longStopPrice)

if (strategy.position_size < 0)
    strategy.exit(id="XS STP", stop=shortStopPrice)